


Frustrated with...
Not being able to quickly help your agents when they call?
Not knowing which agent to contact next?
Not knowing what’s going on with your agents?

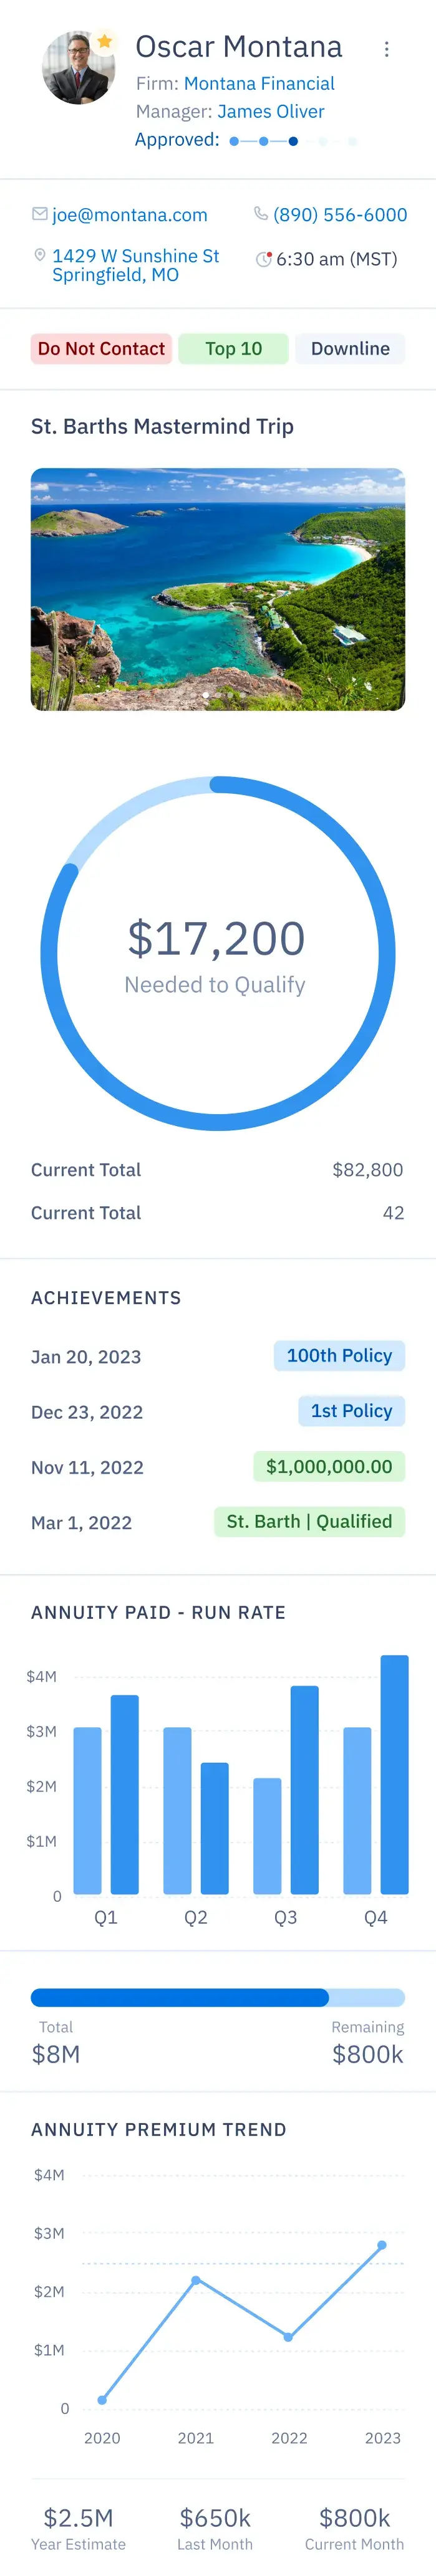
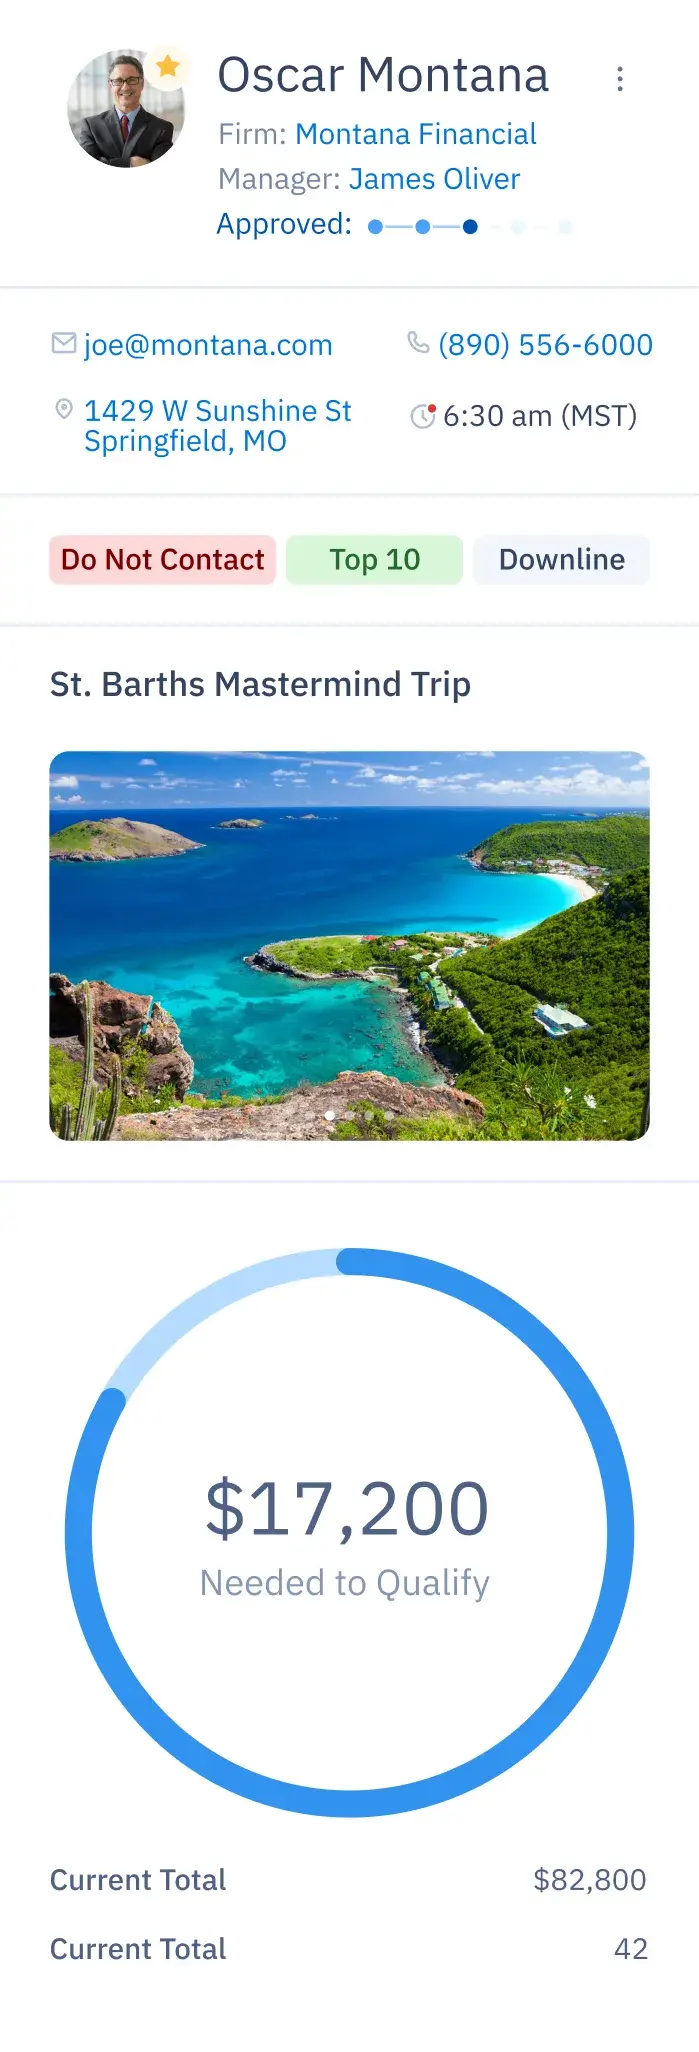
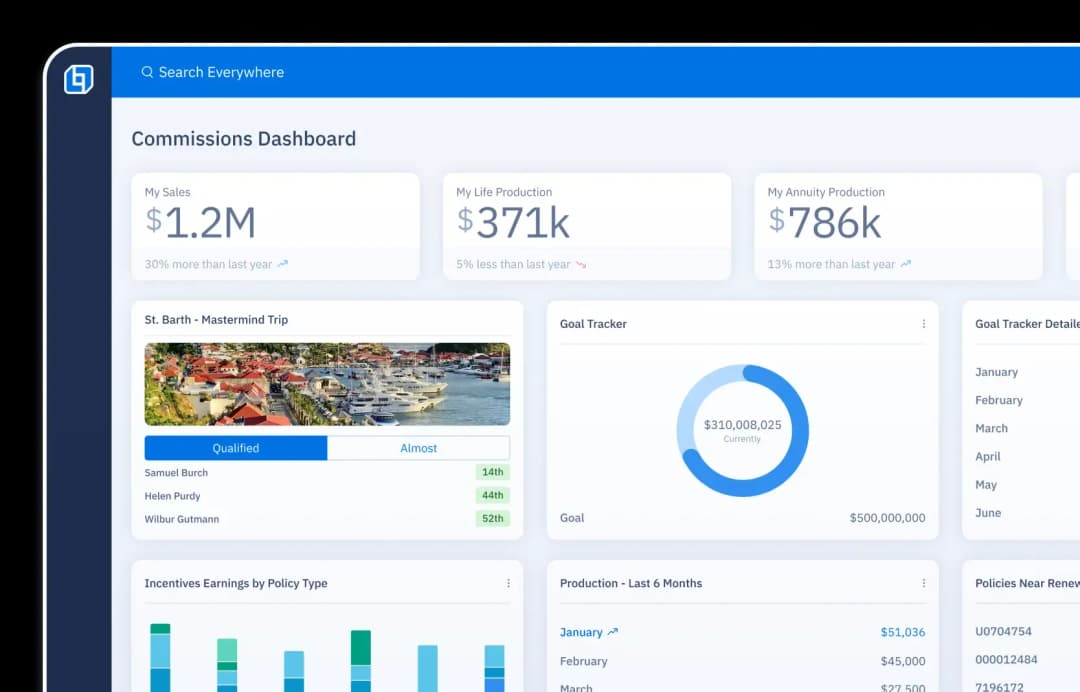
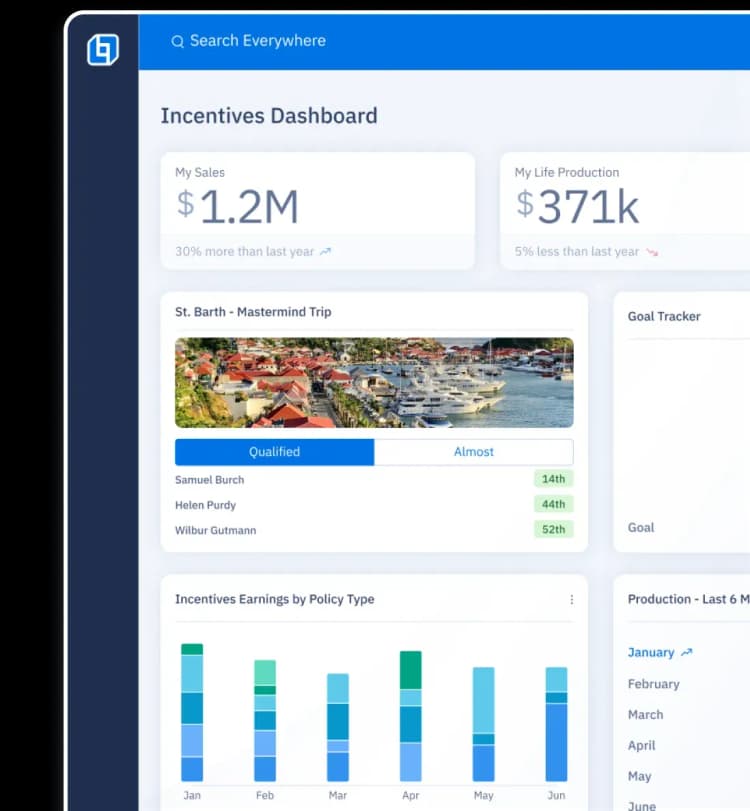
Monitor progress toward trips and incentives.
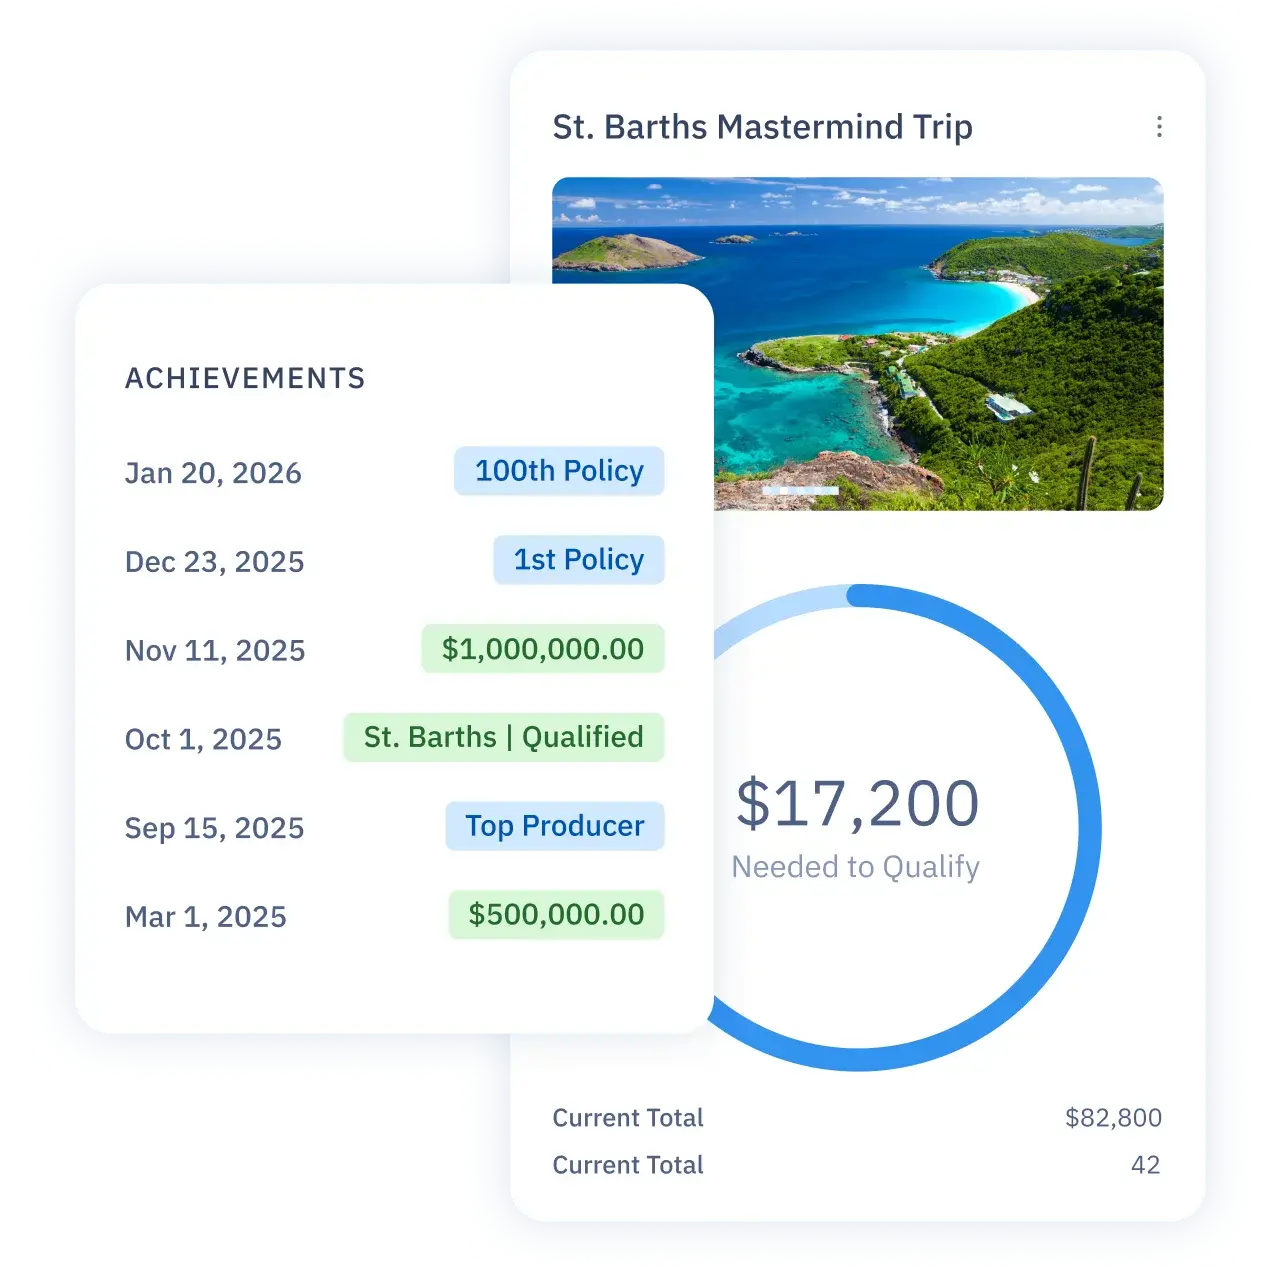
Track agent production and milestones.
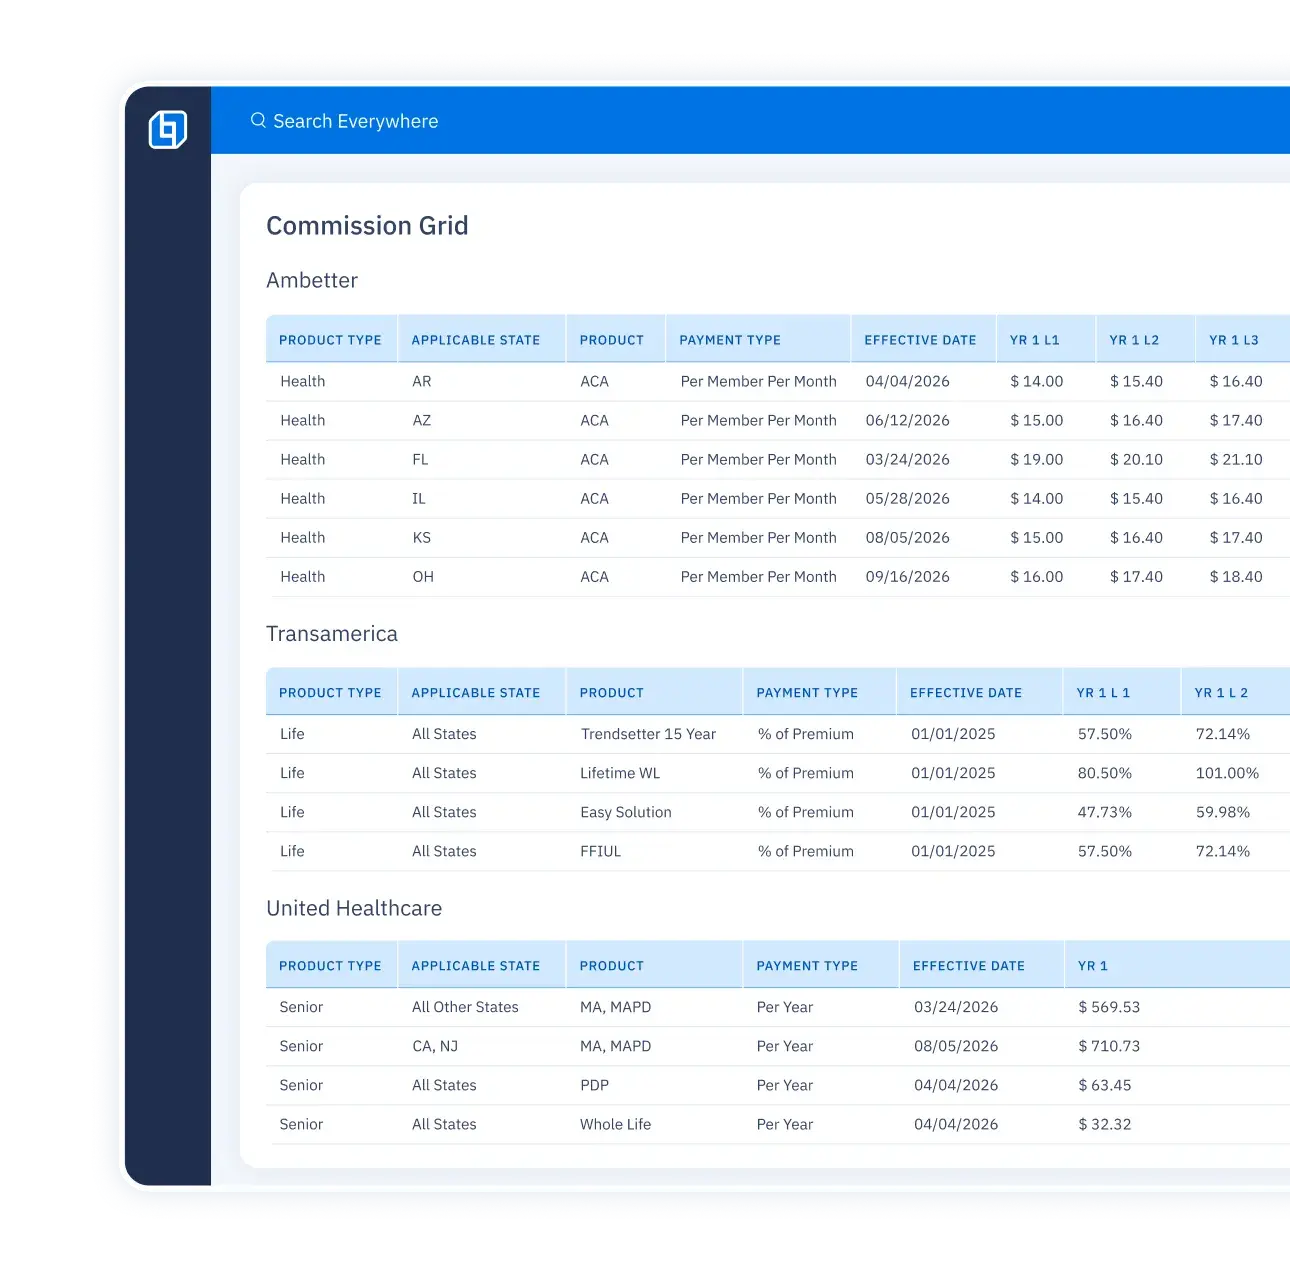
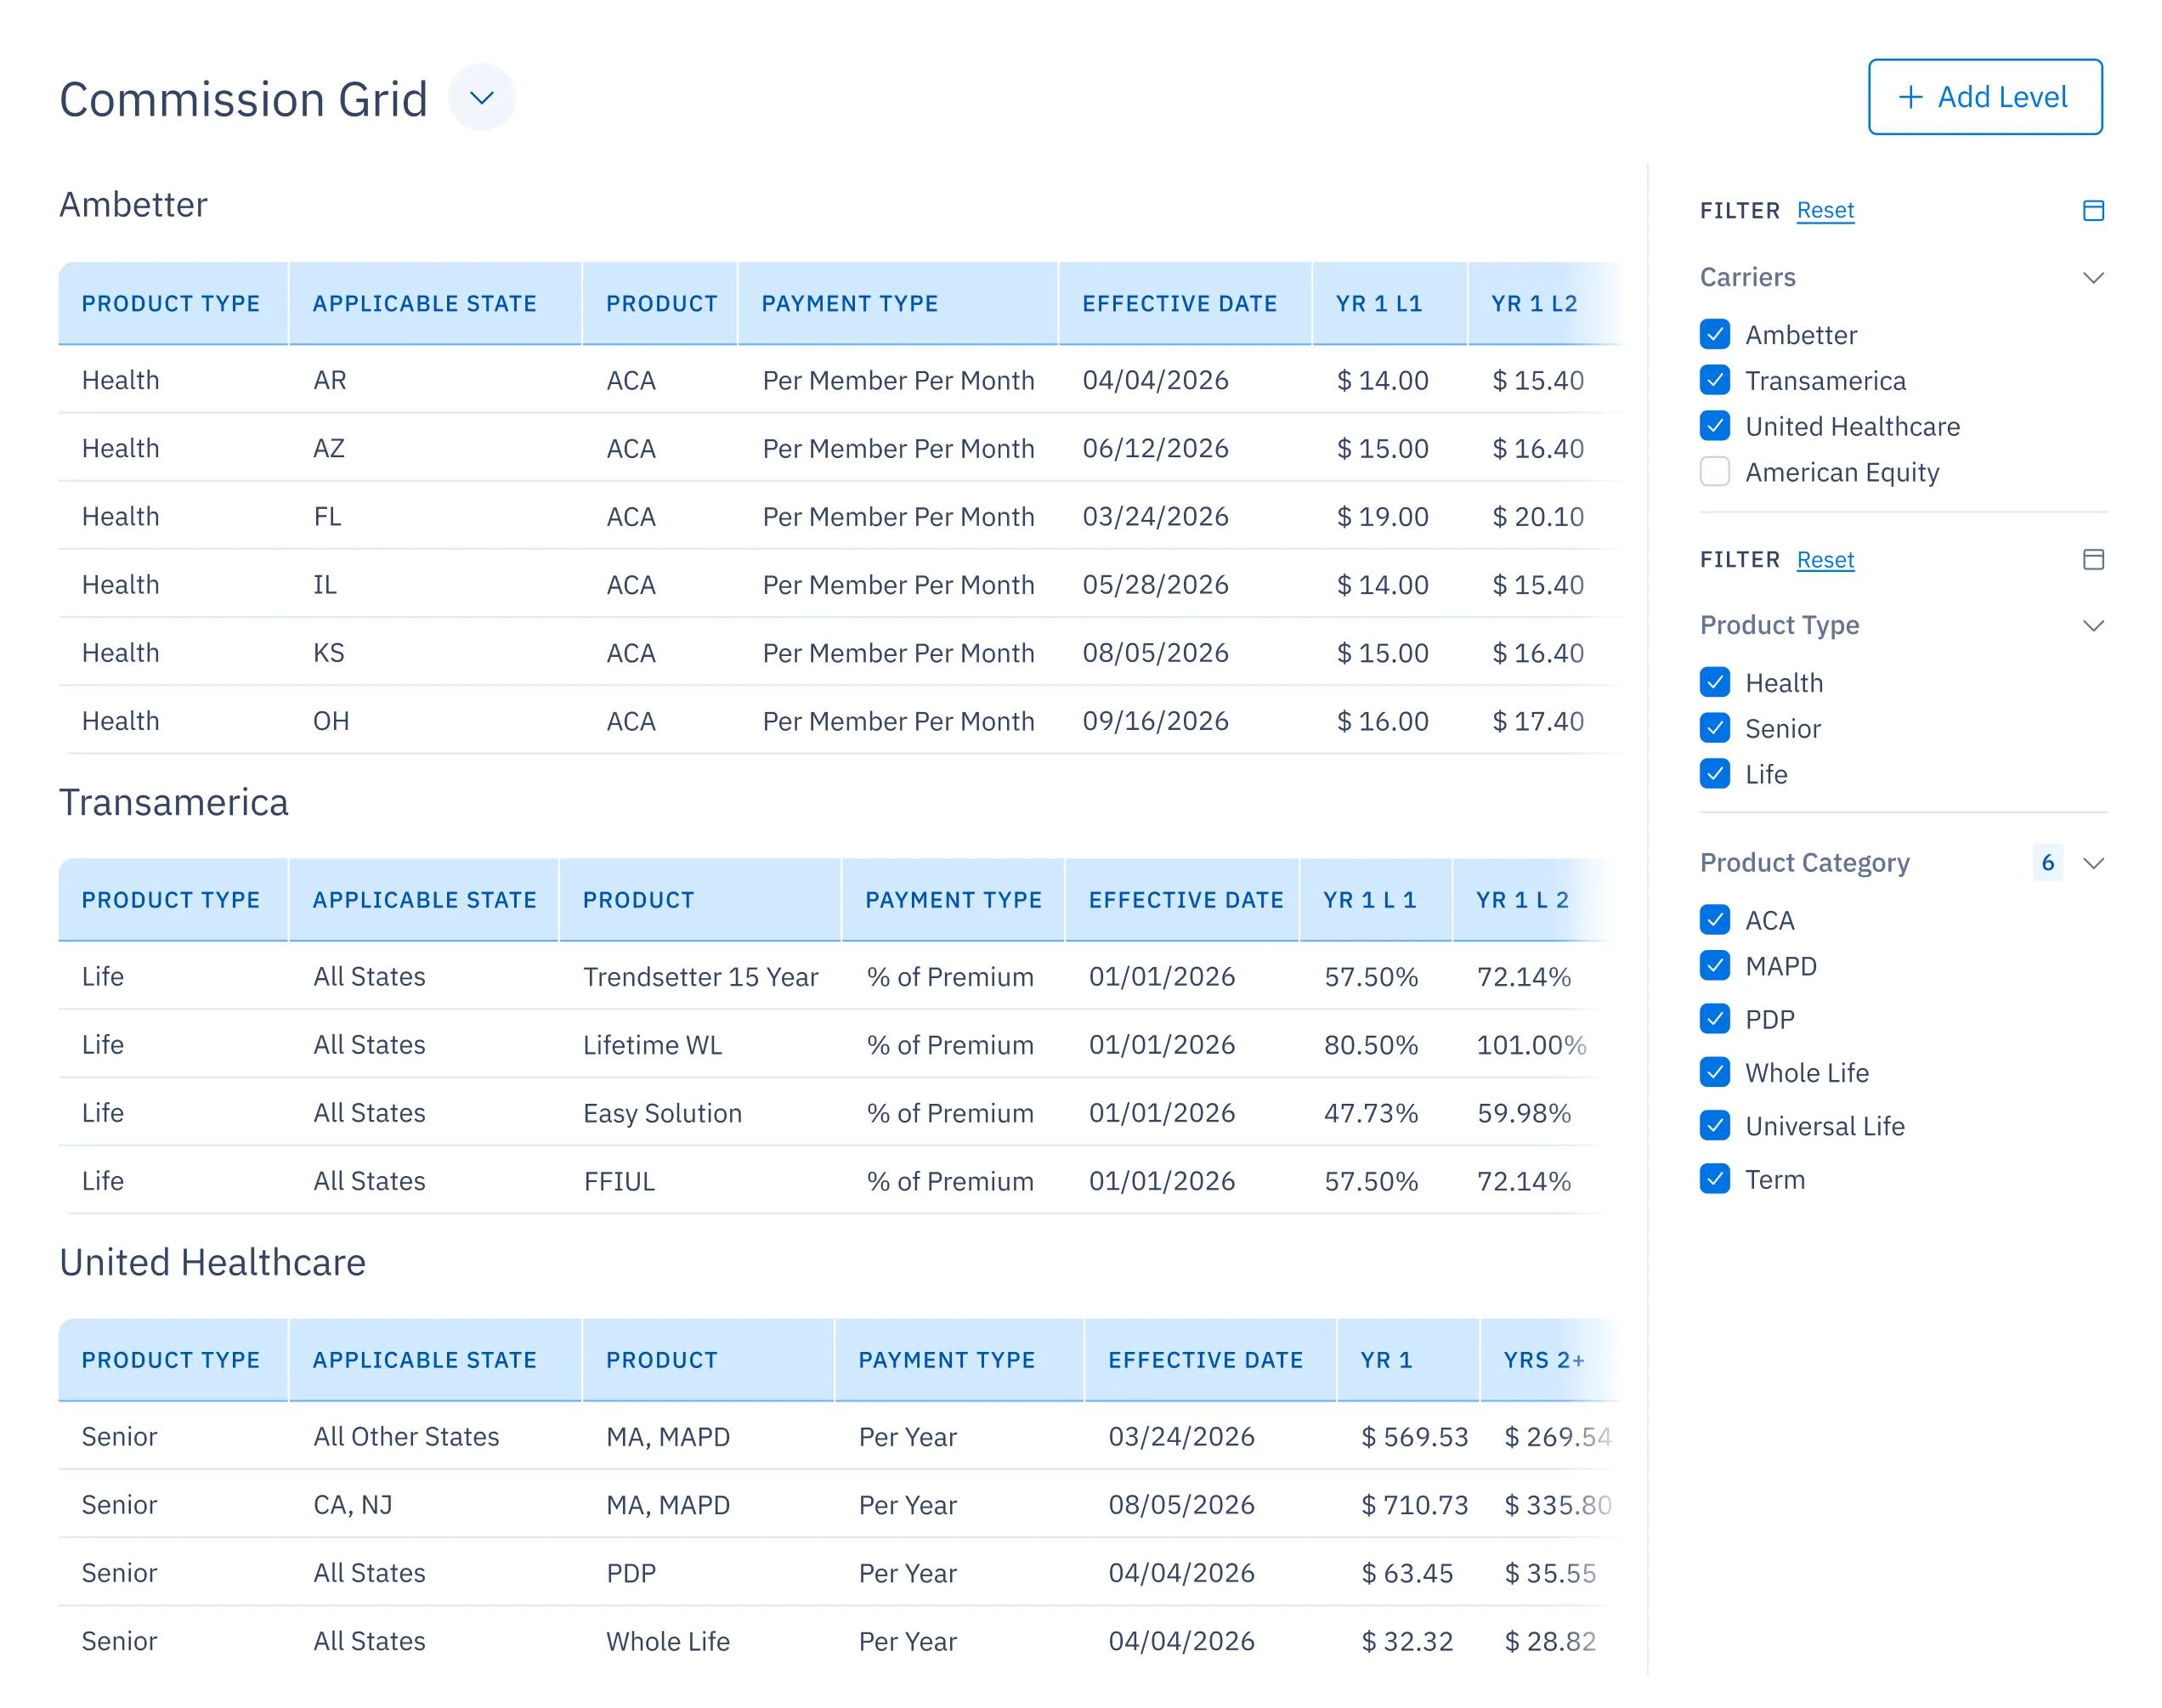
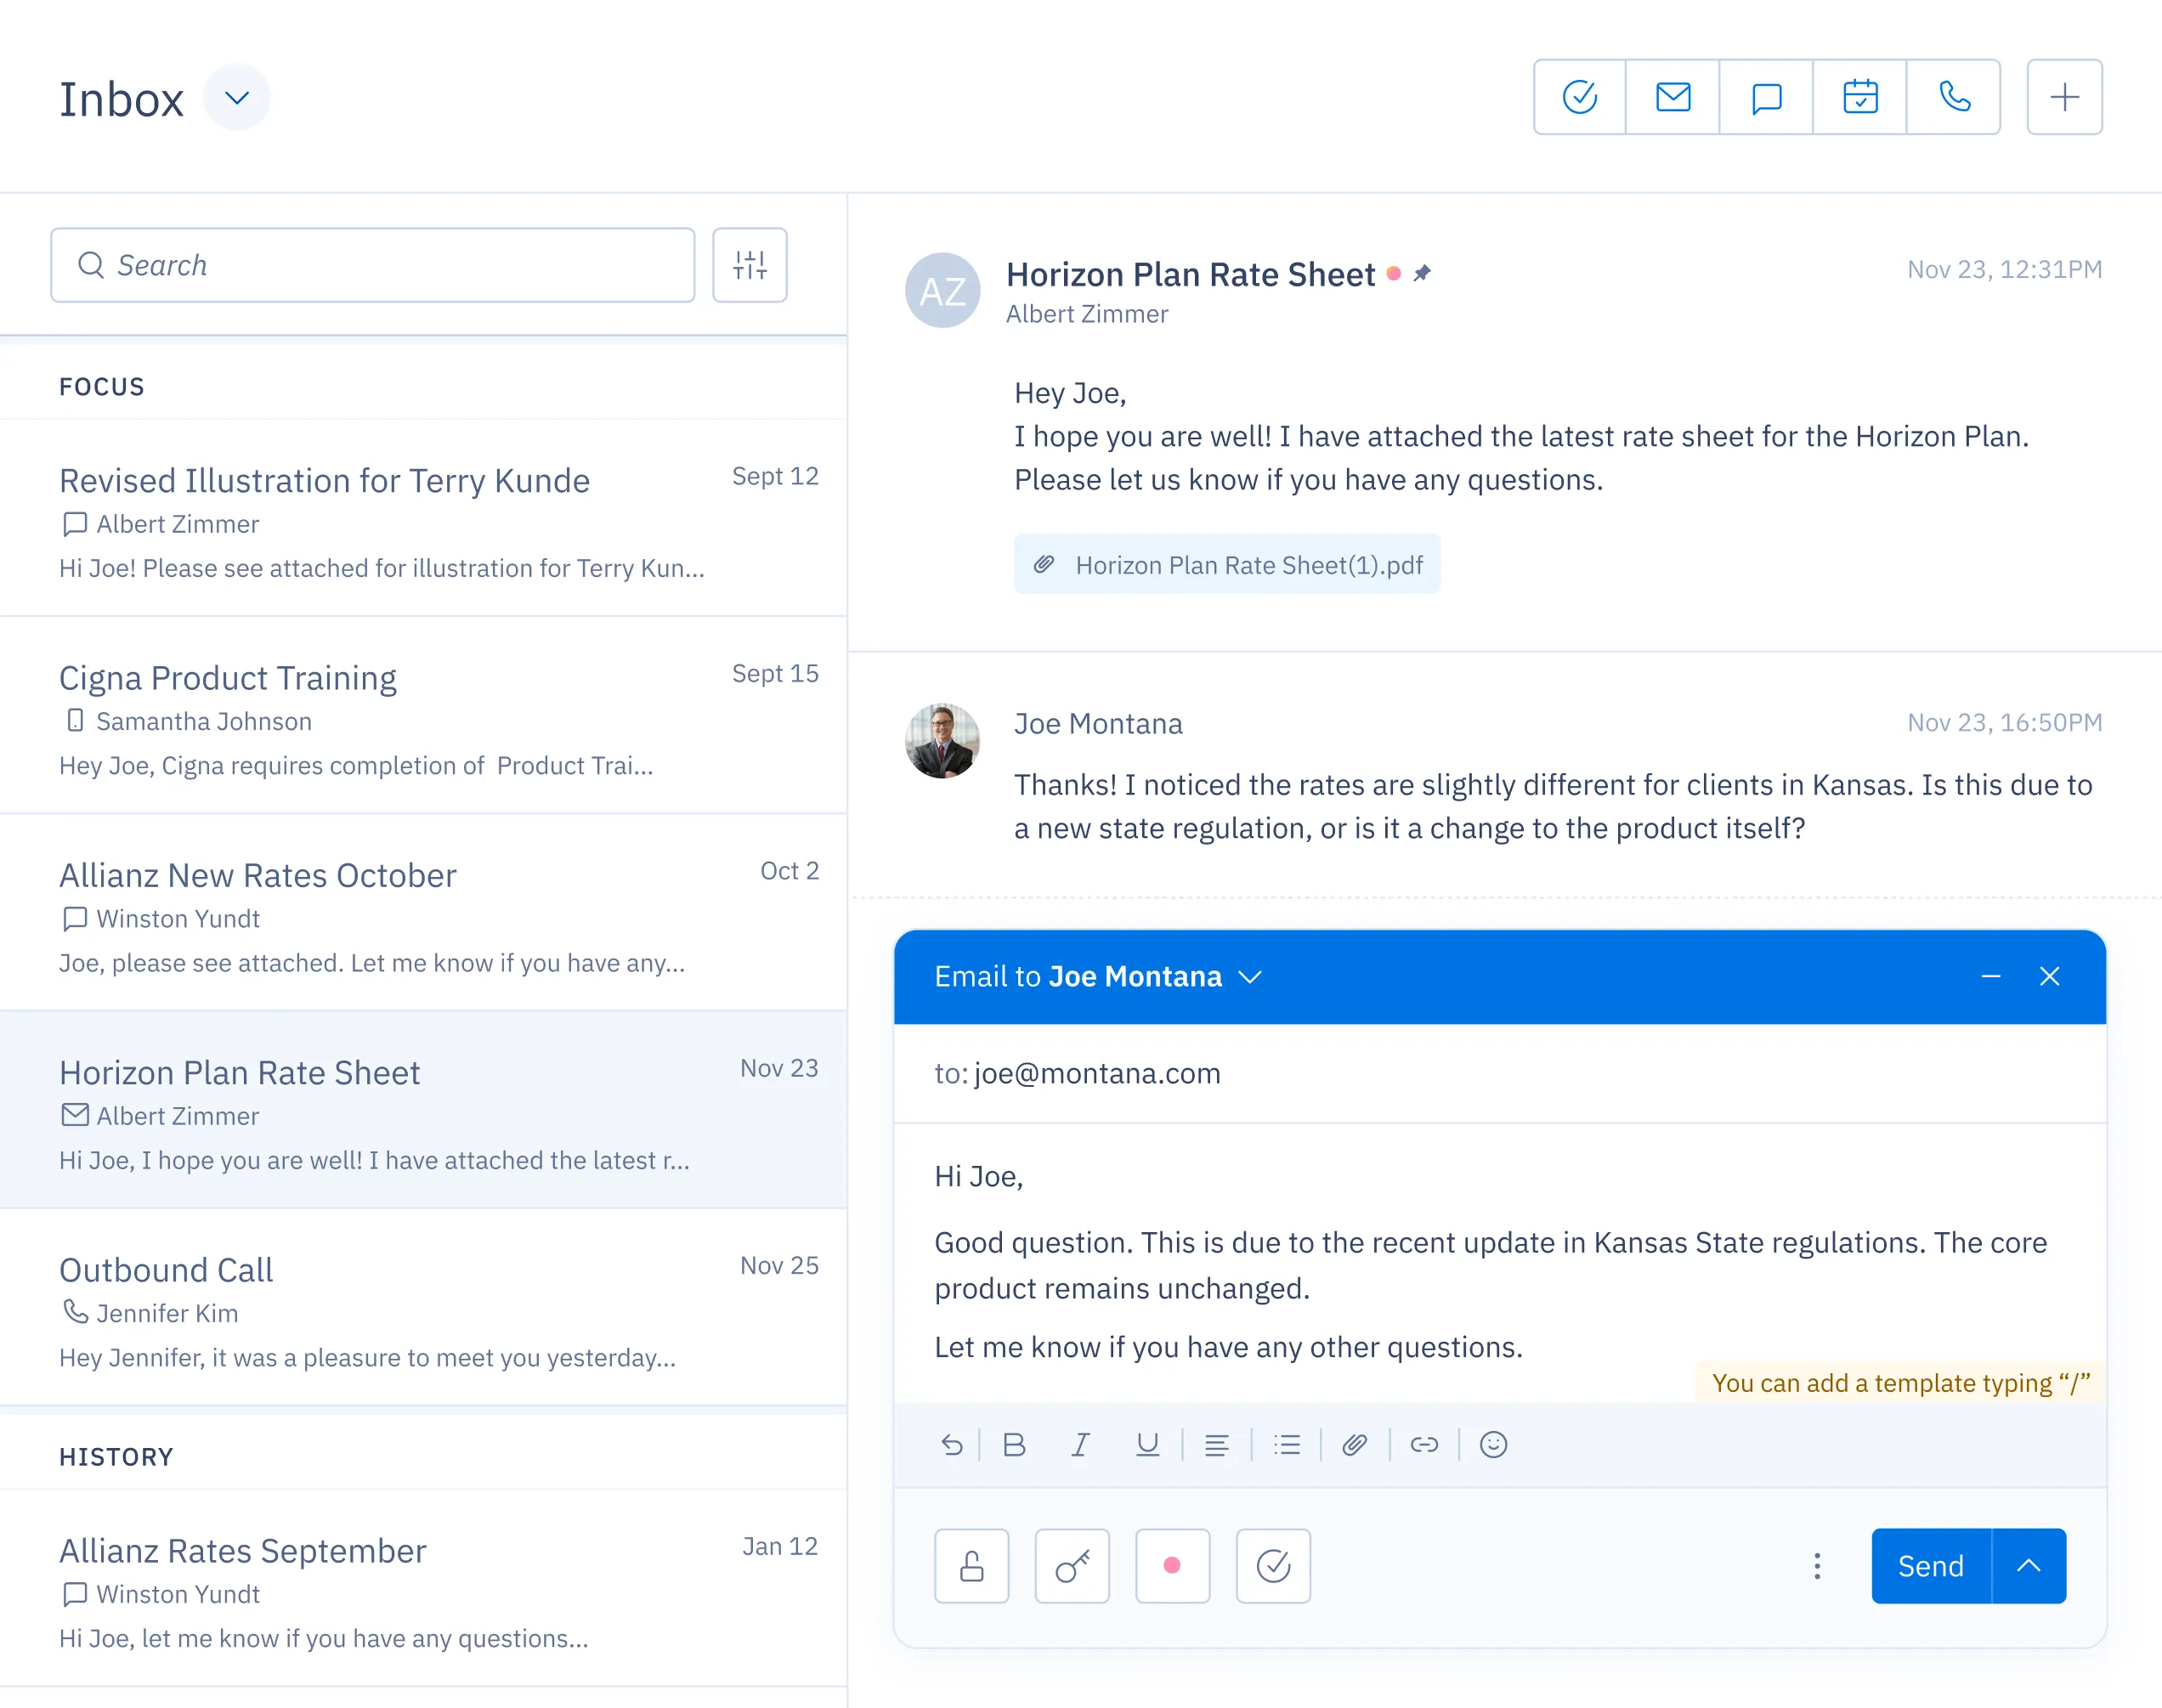
Easily answer commissions questions.
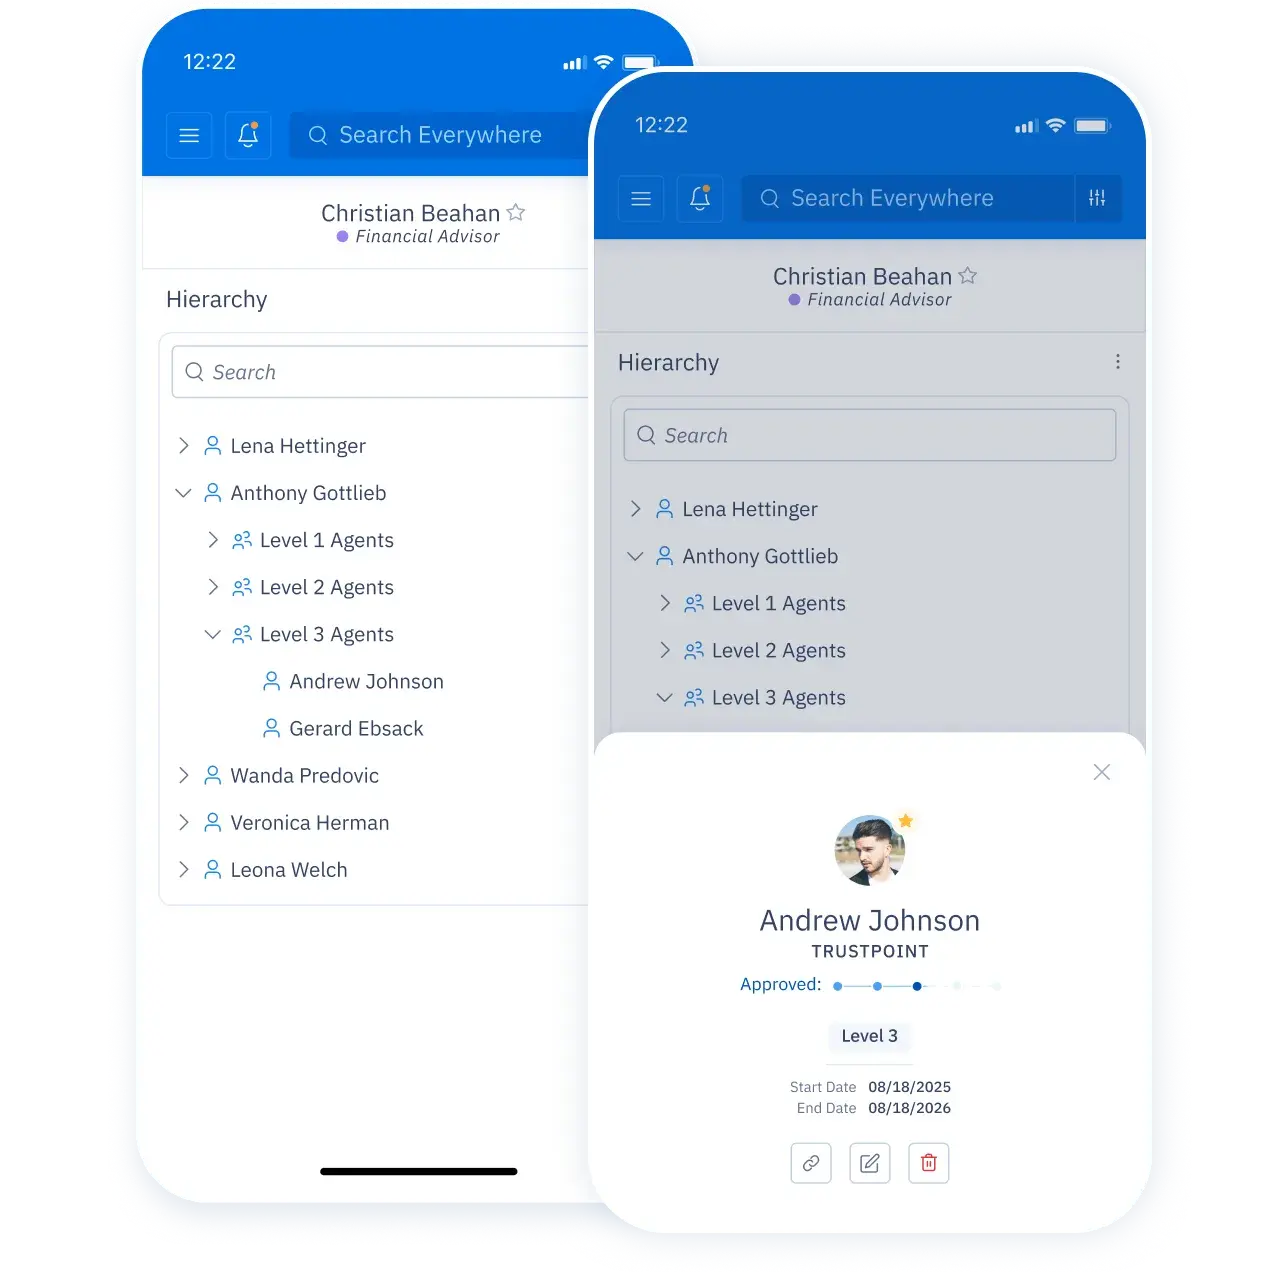
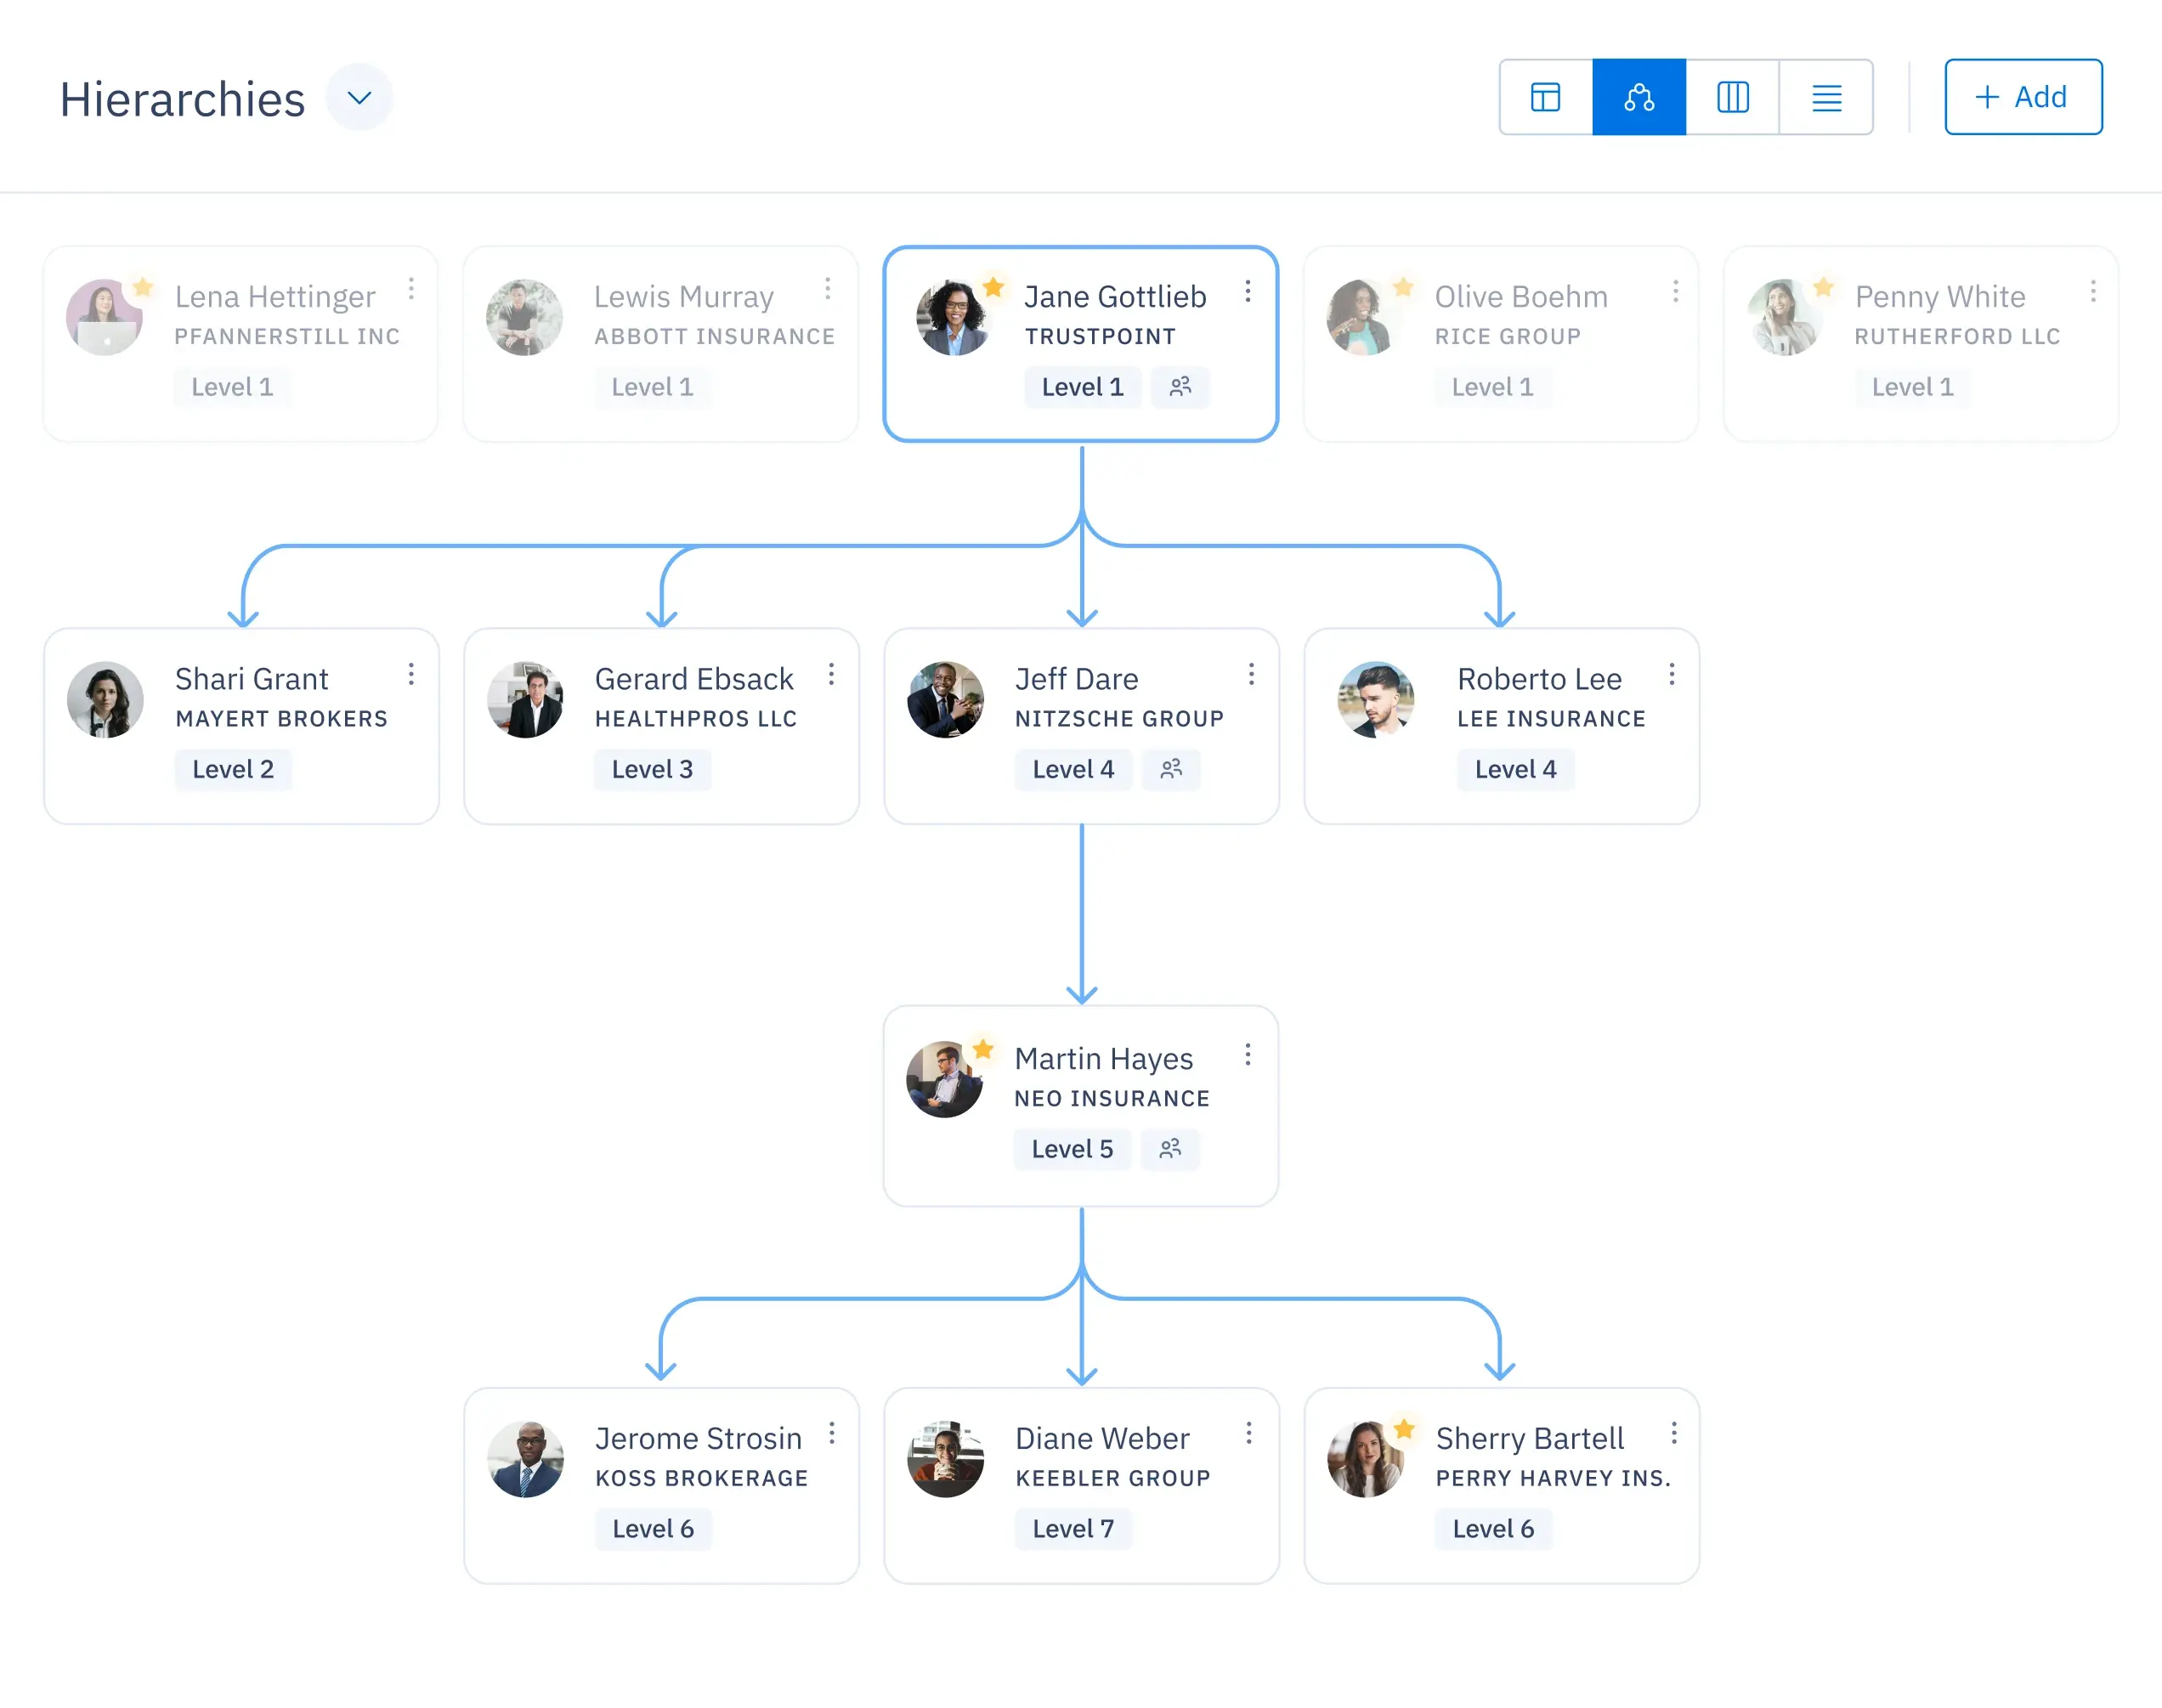
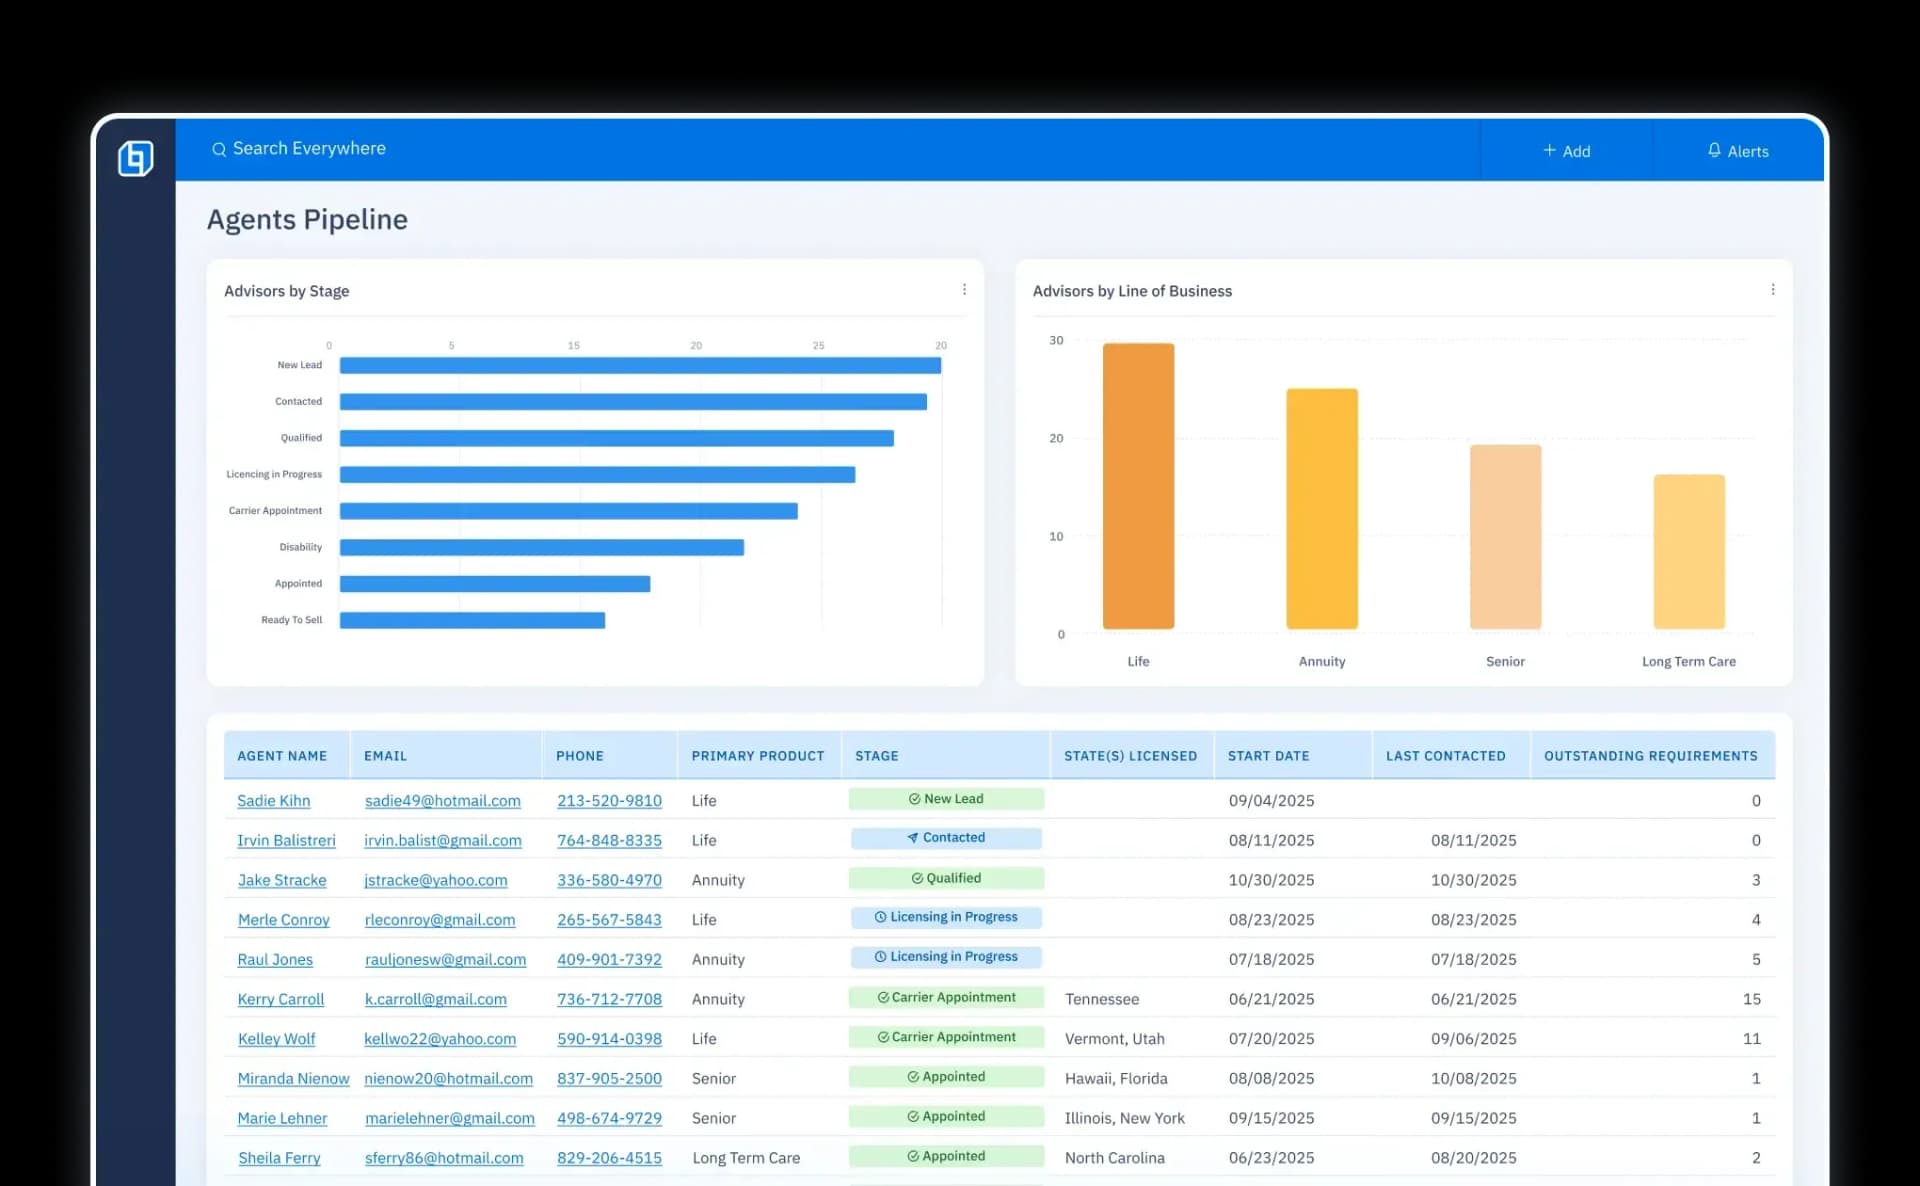
Navigate hierarchies with ease.
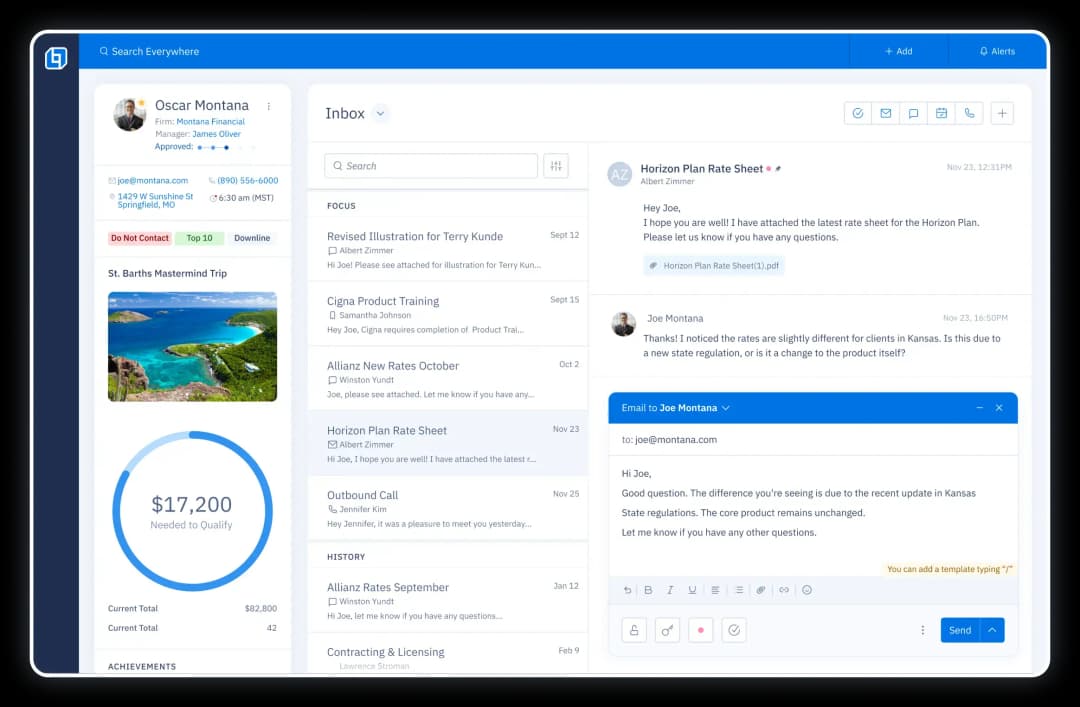
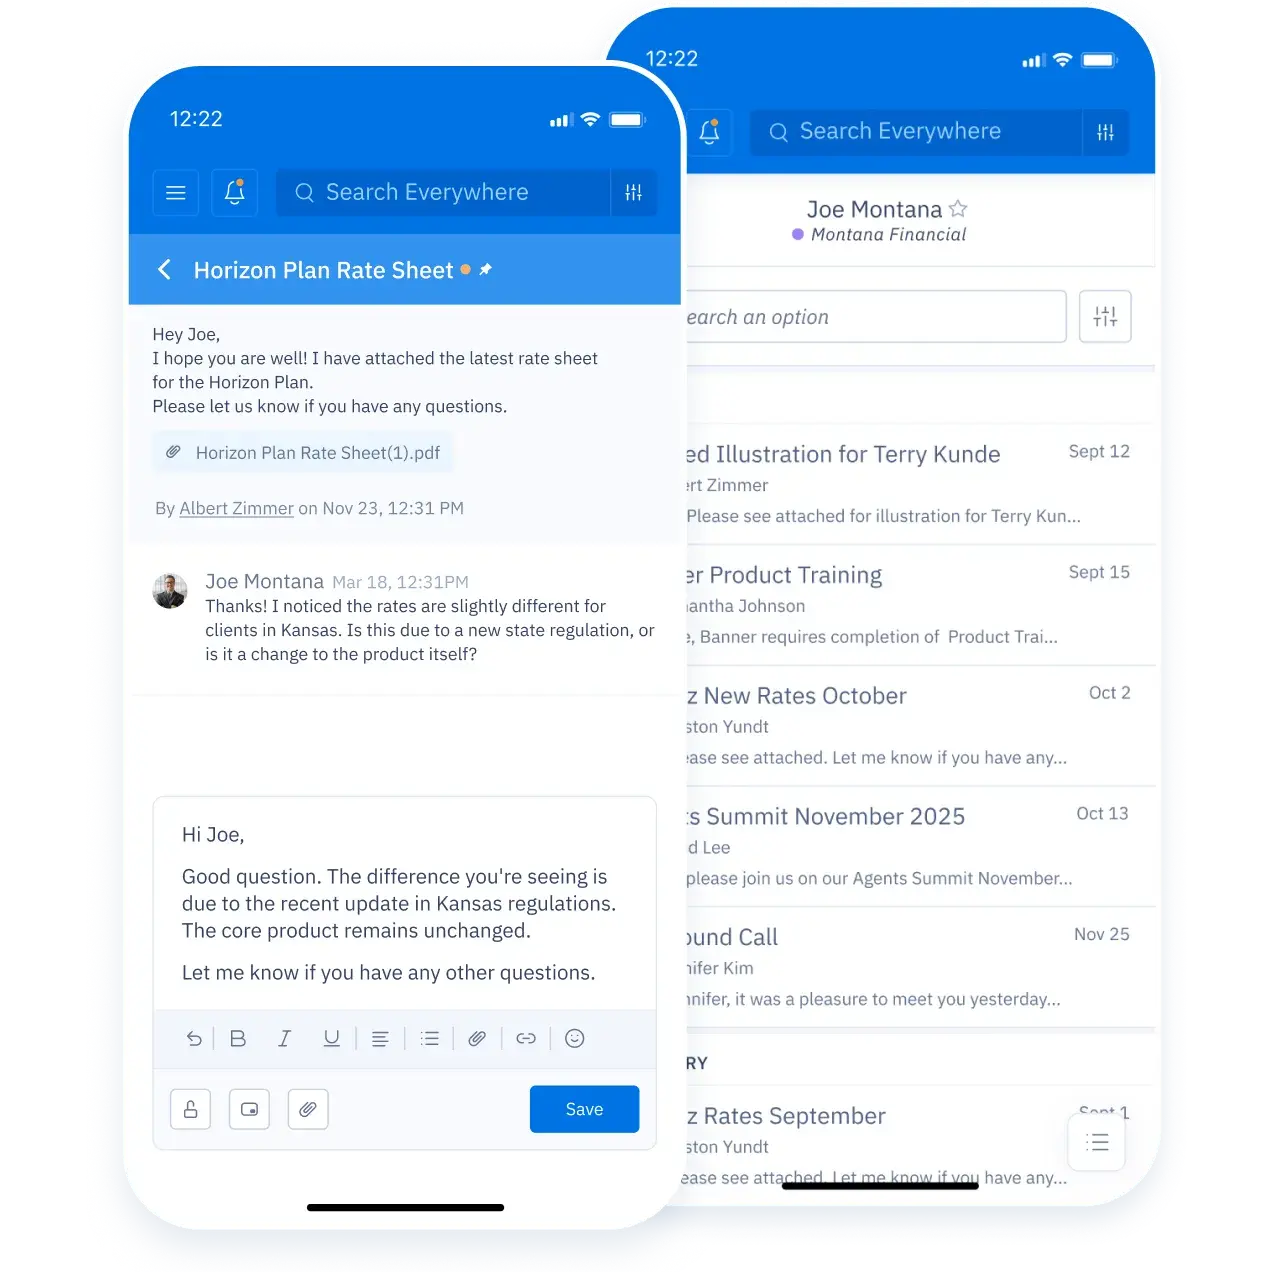
Stay on top of all communication.
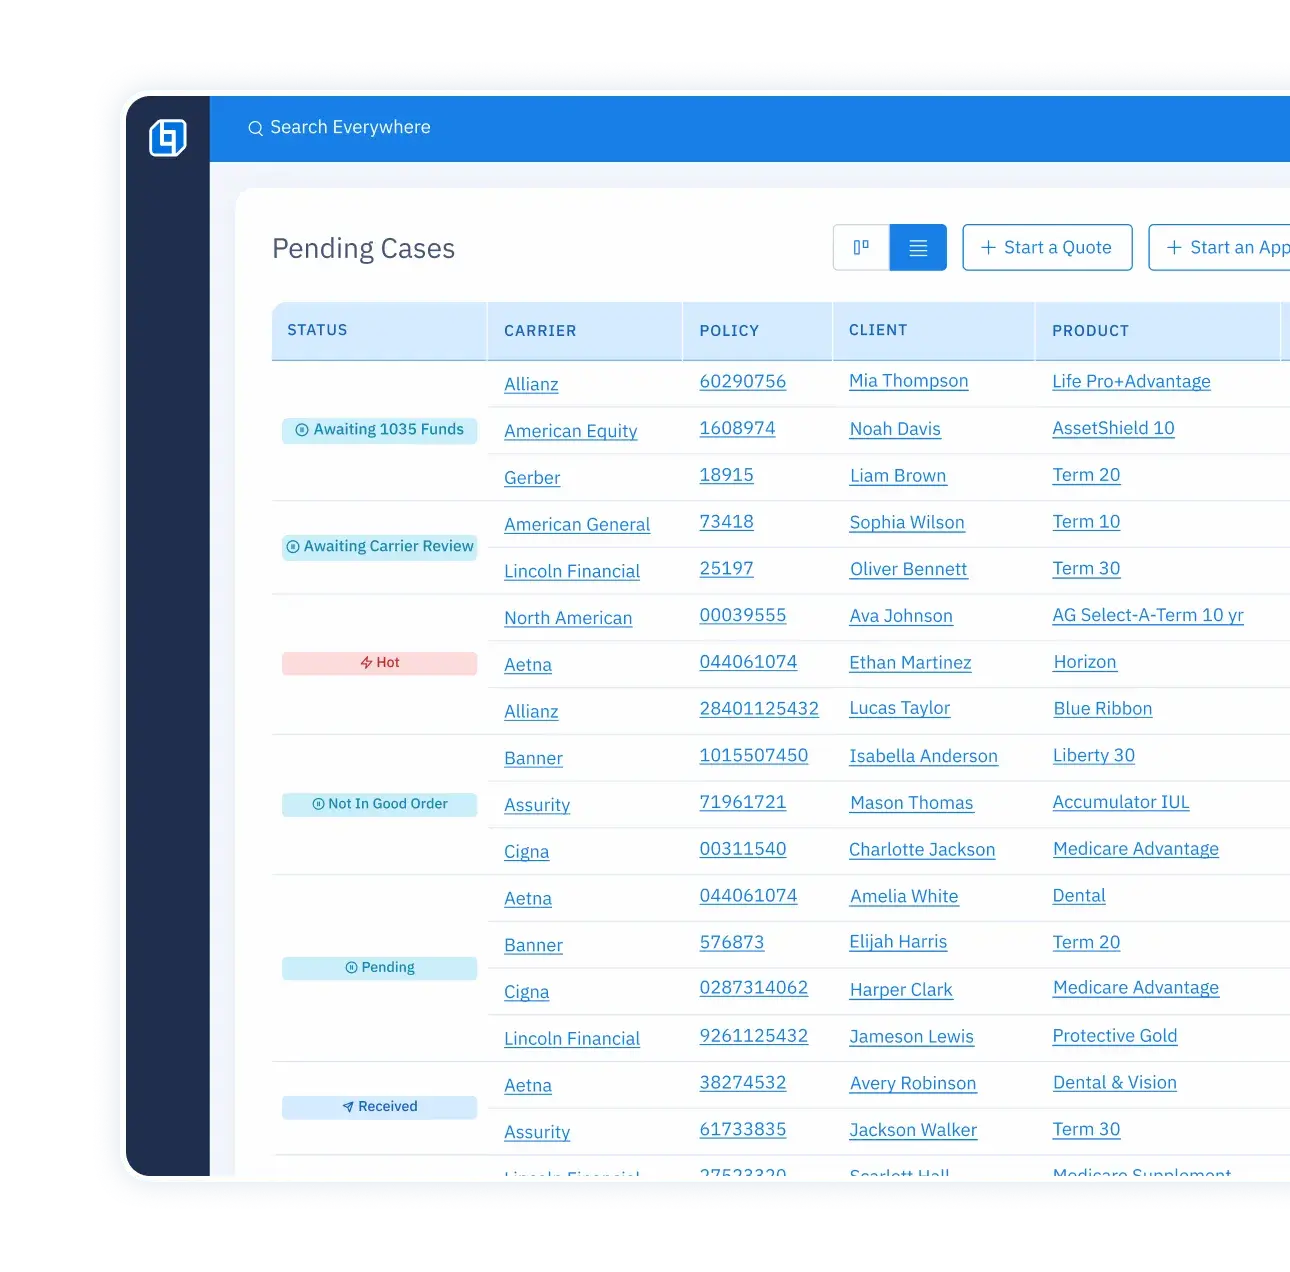
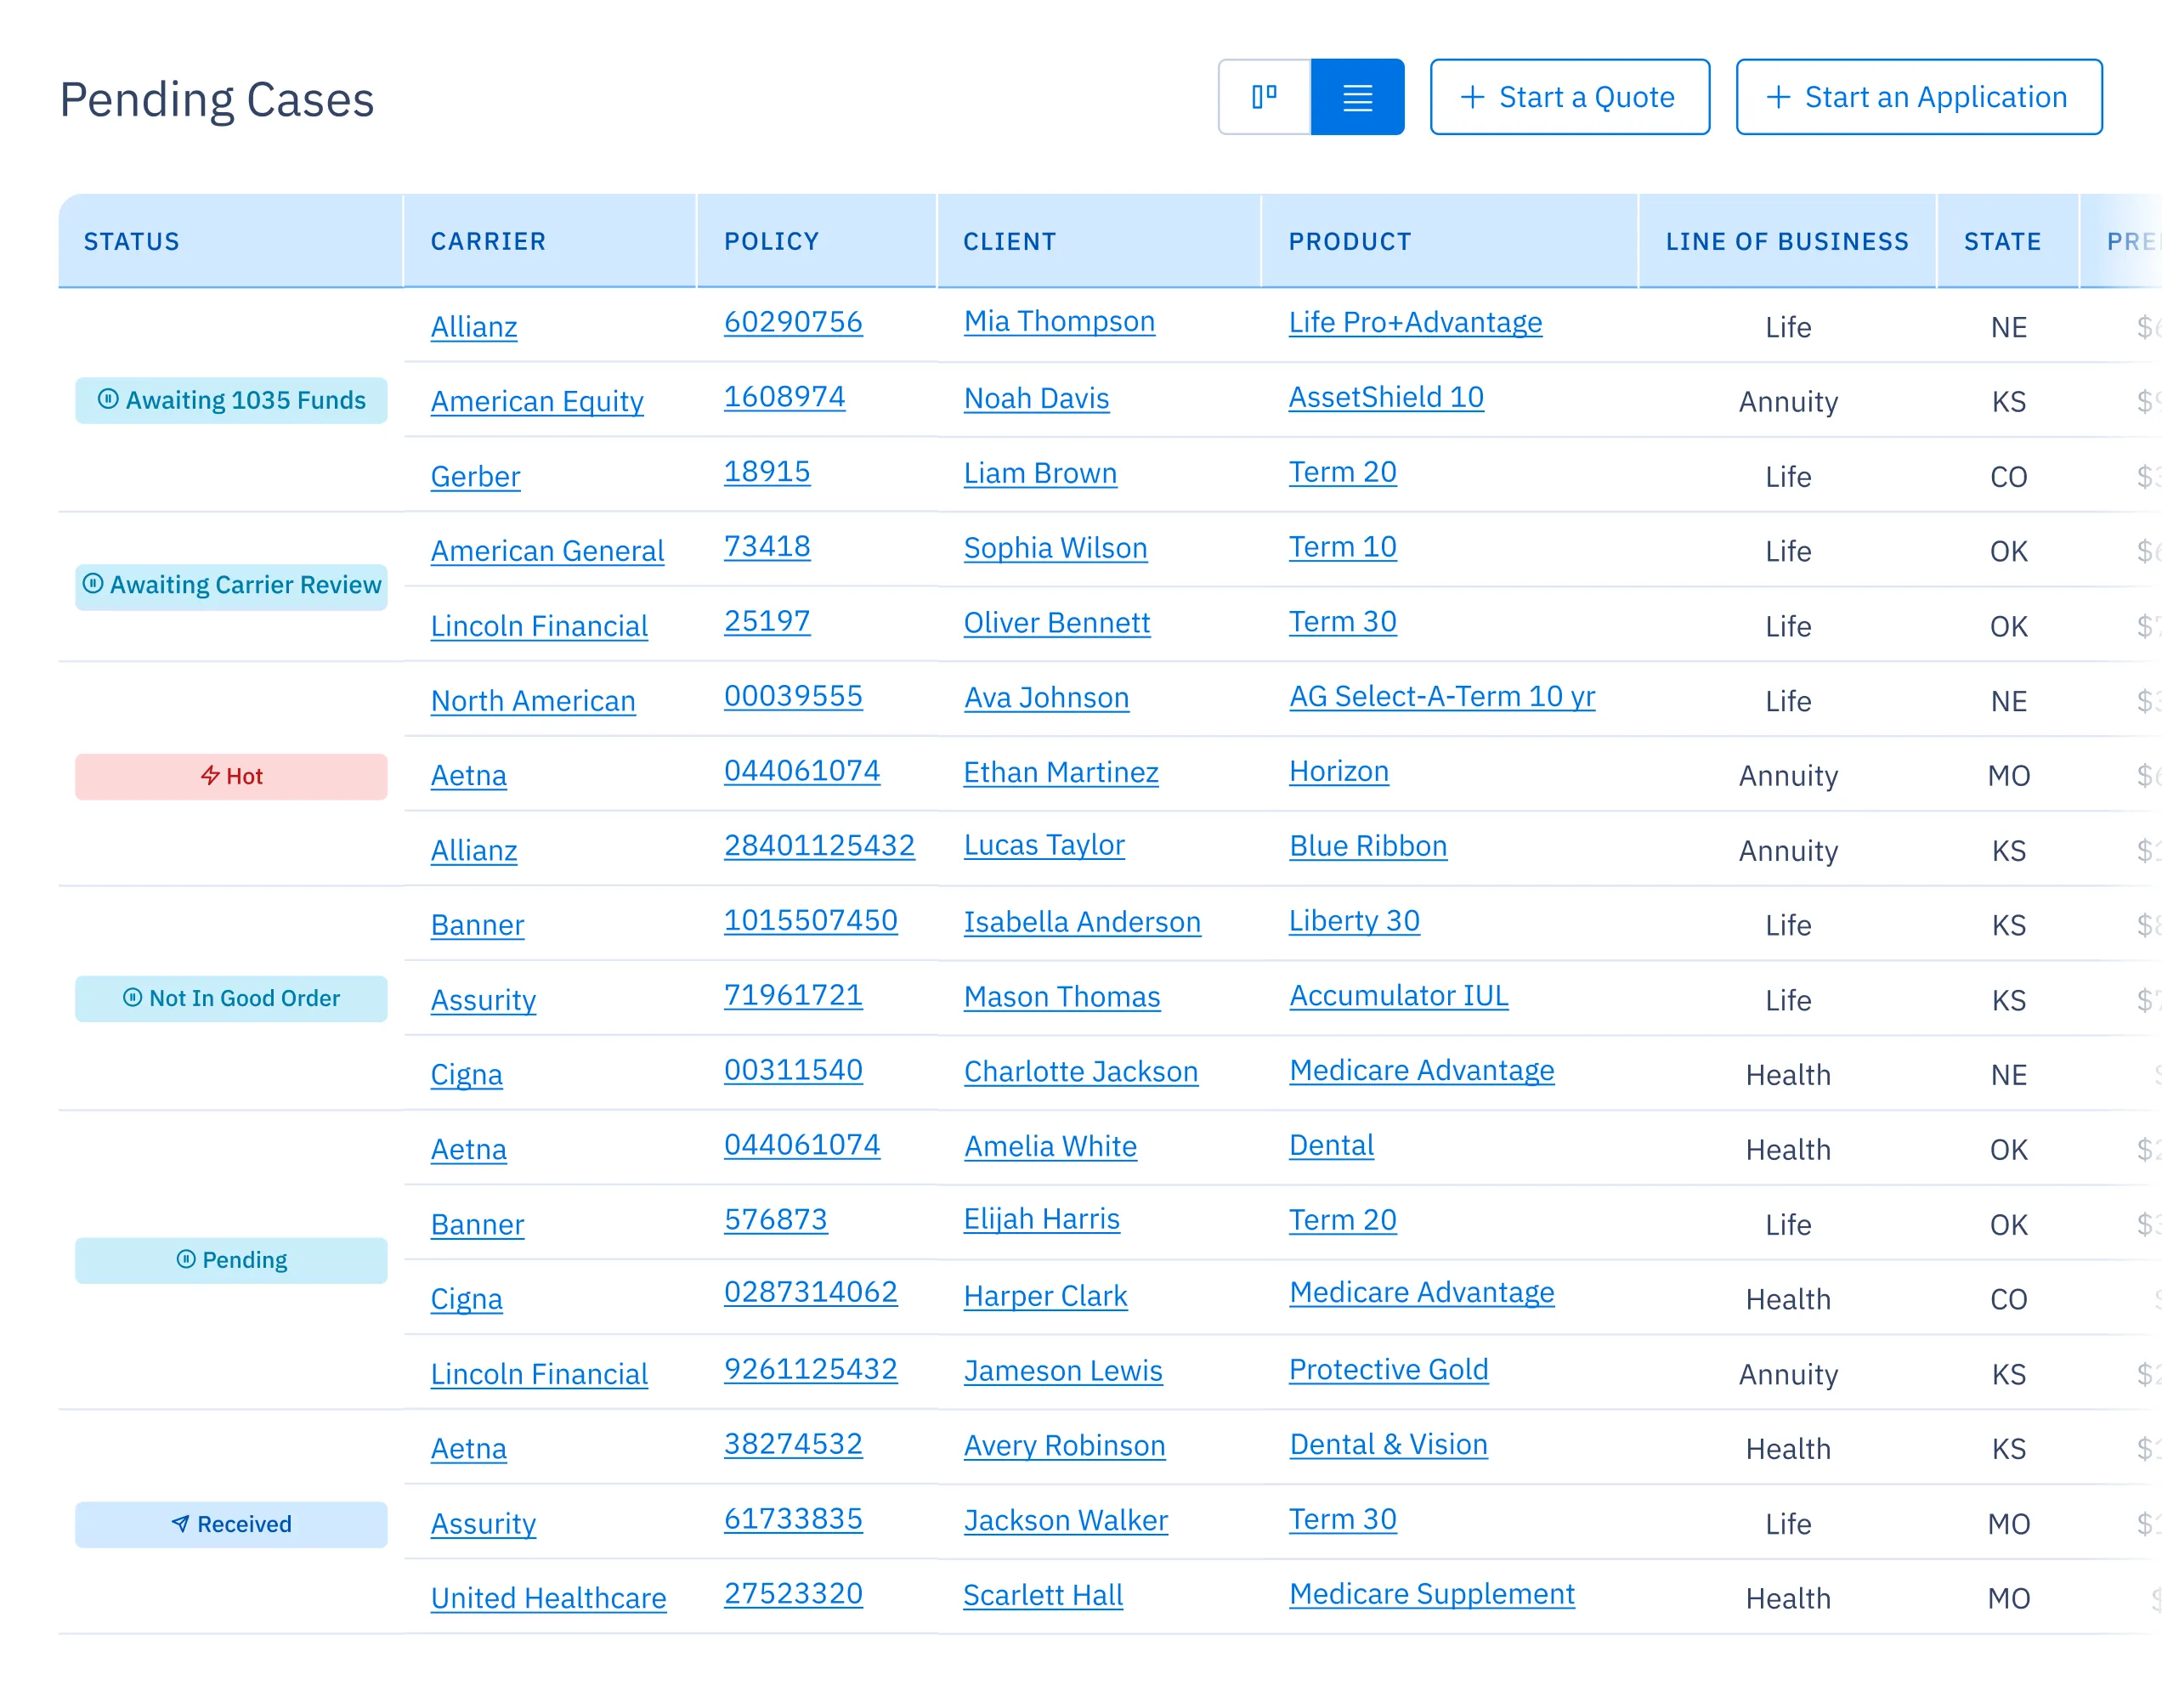
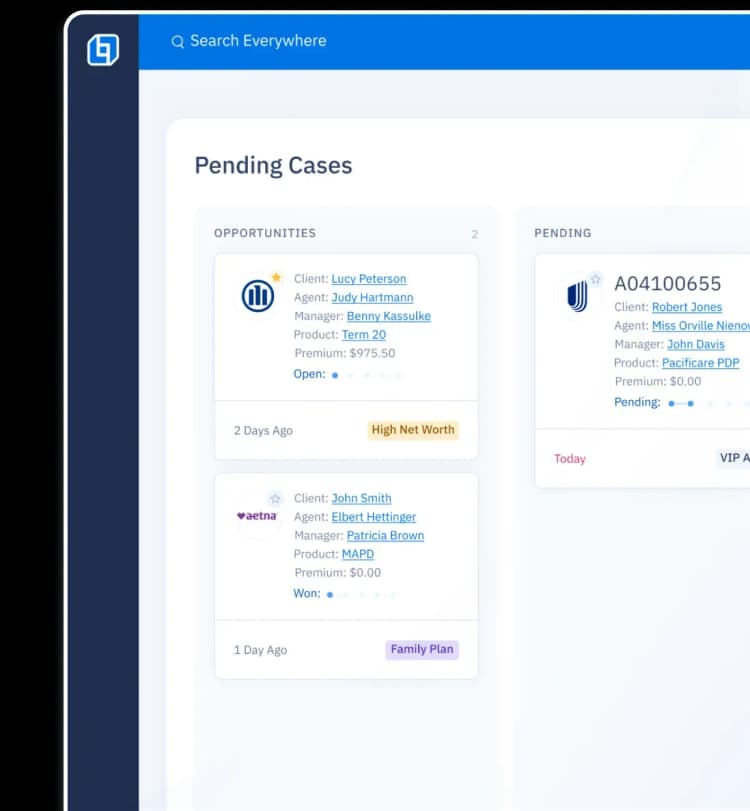
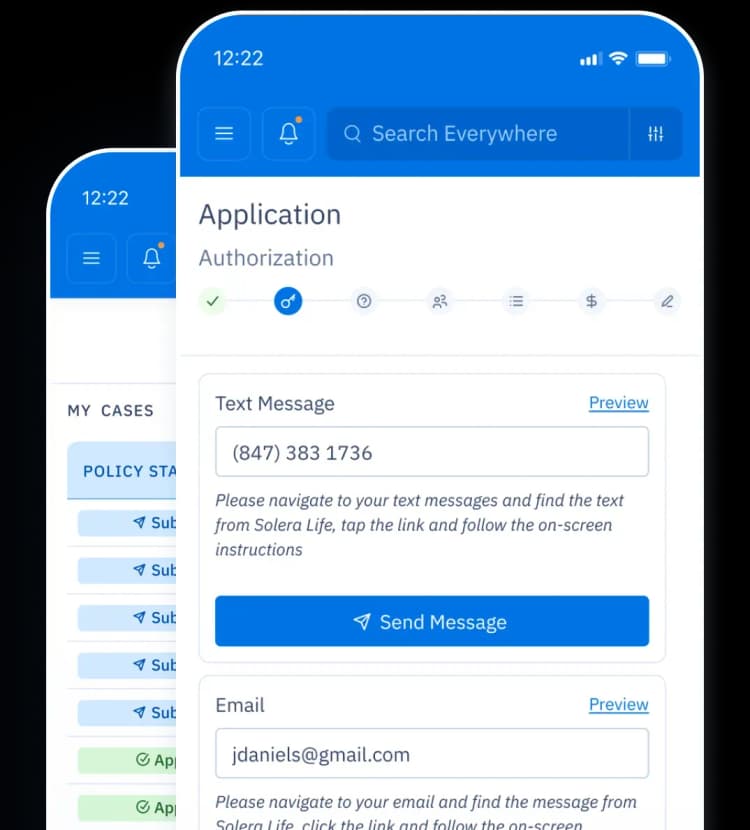
Track your agents' pending cases.
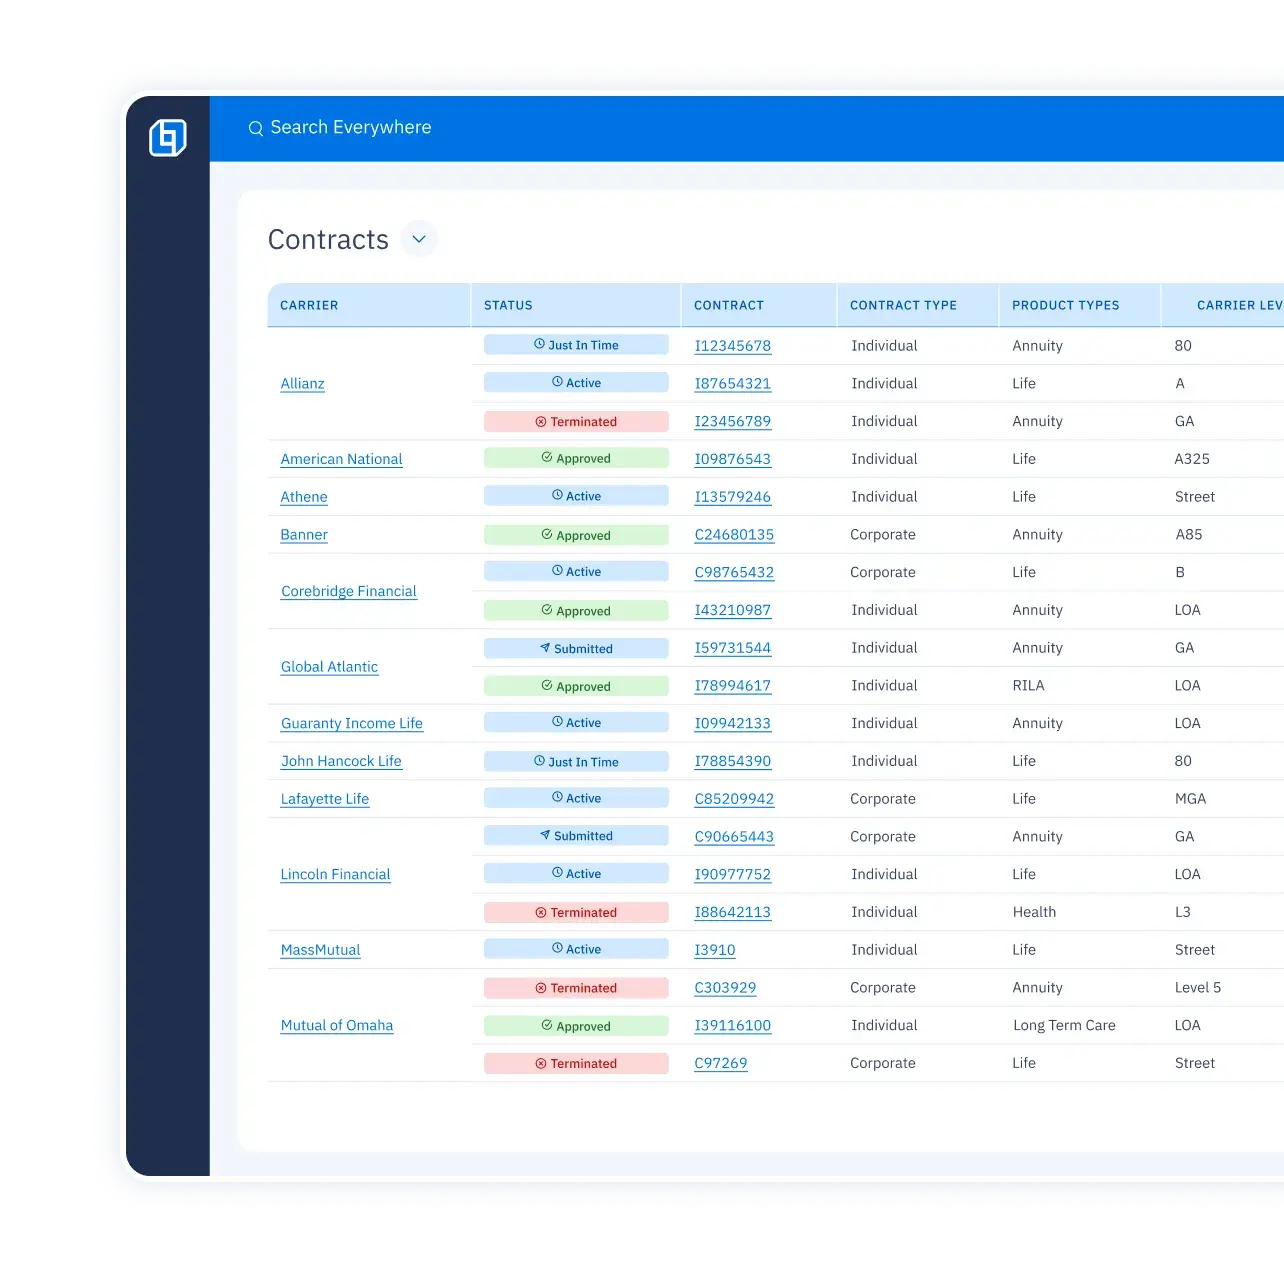
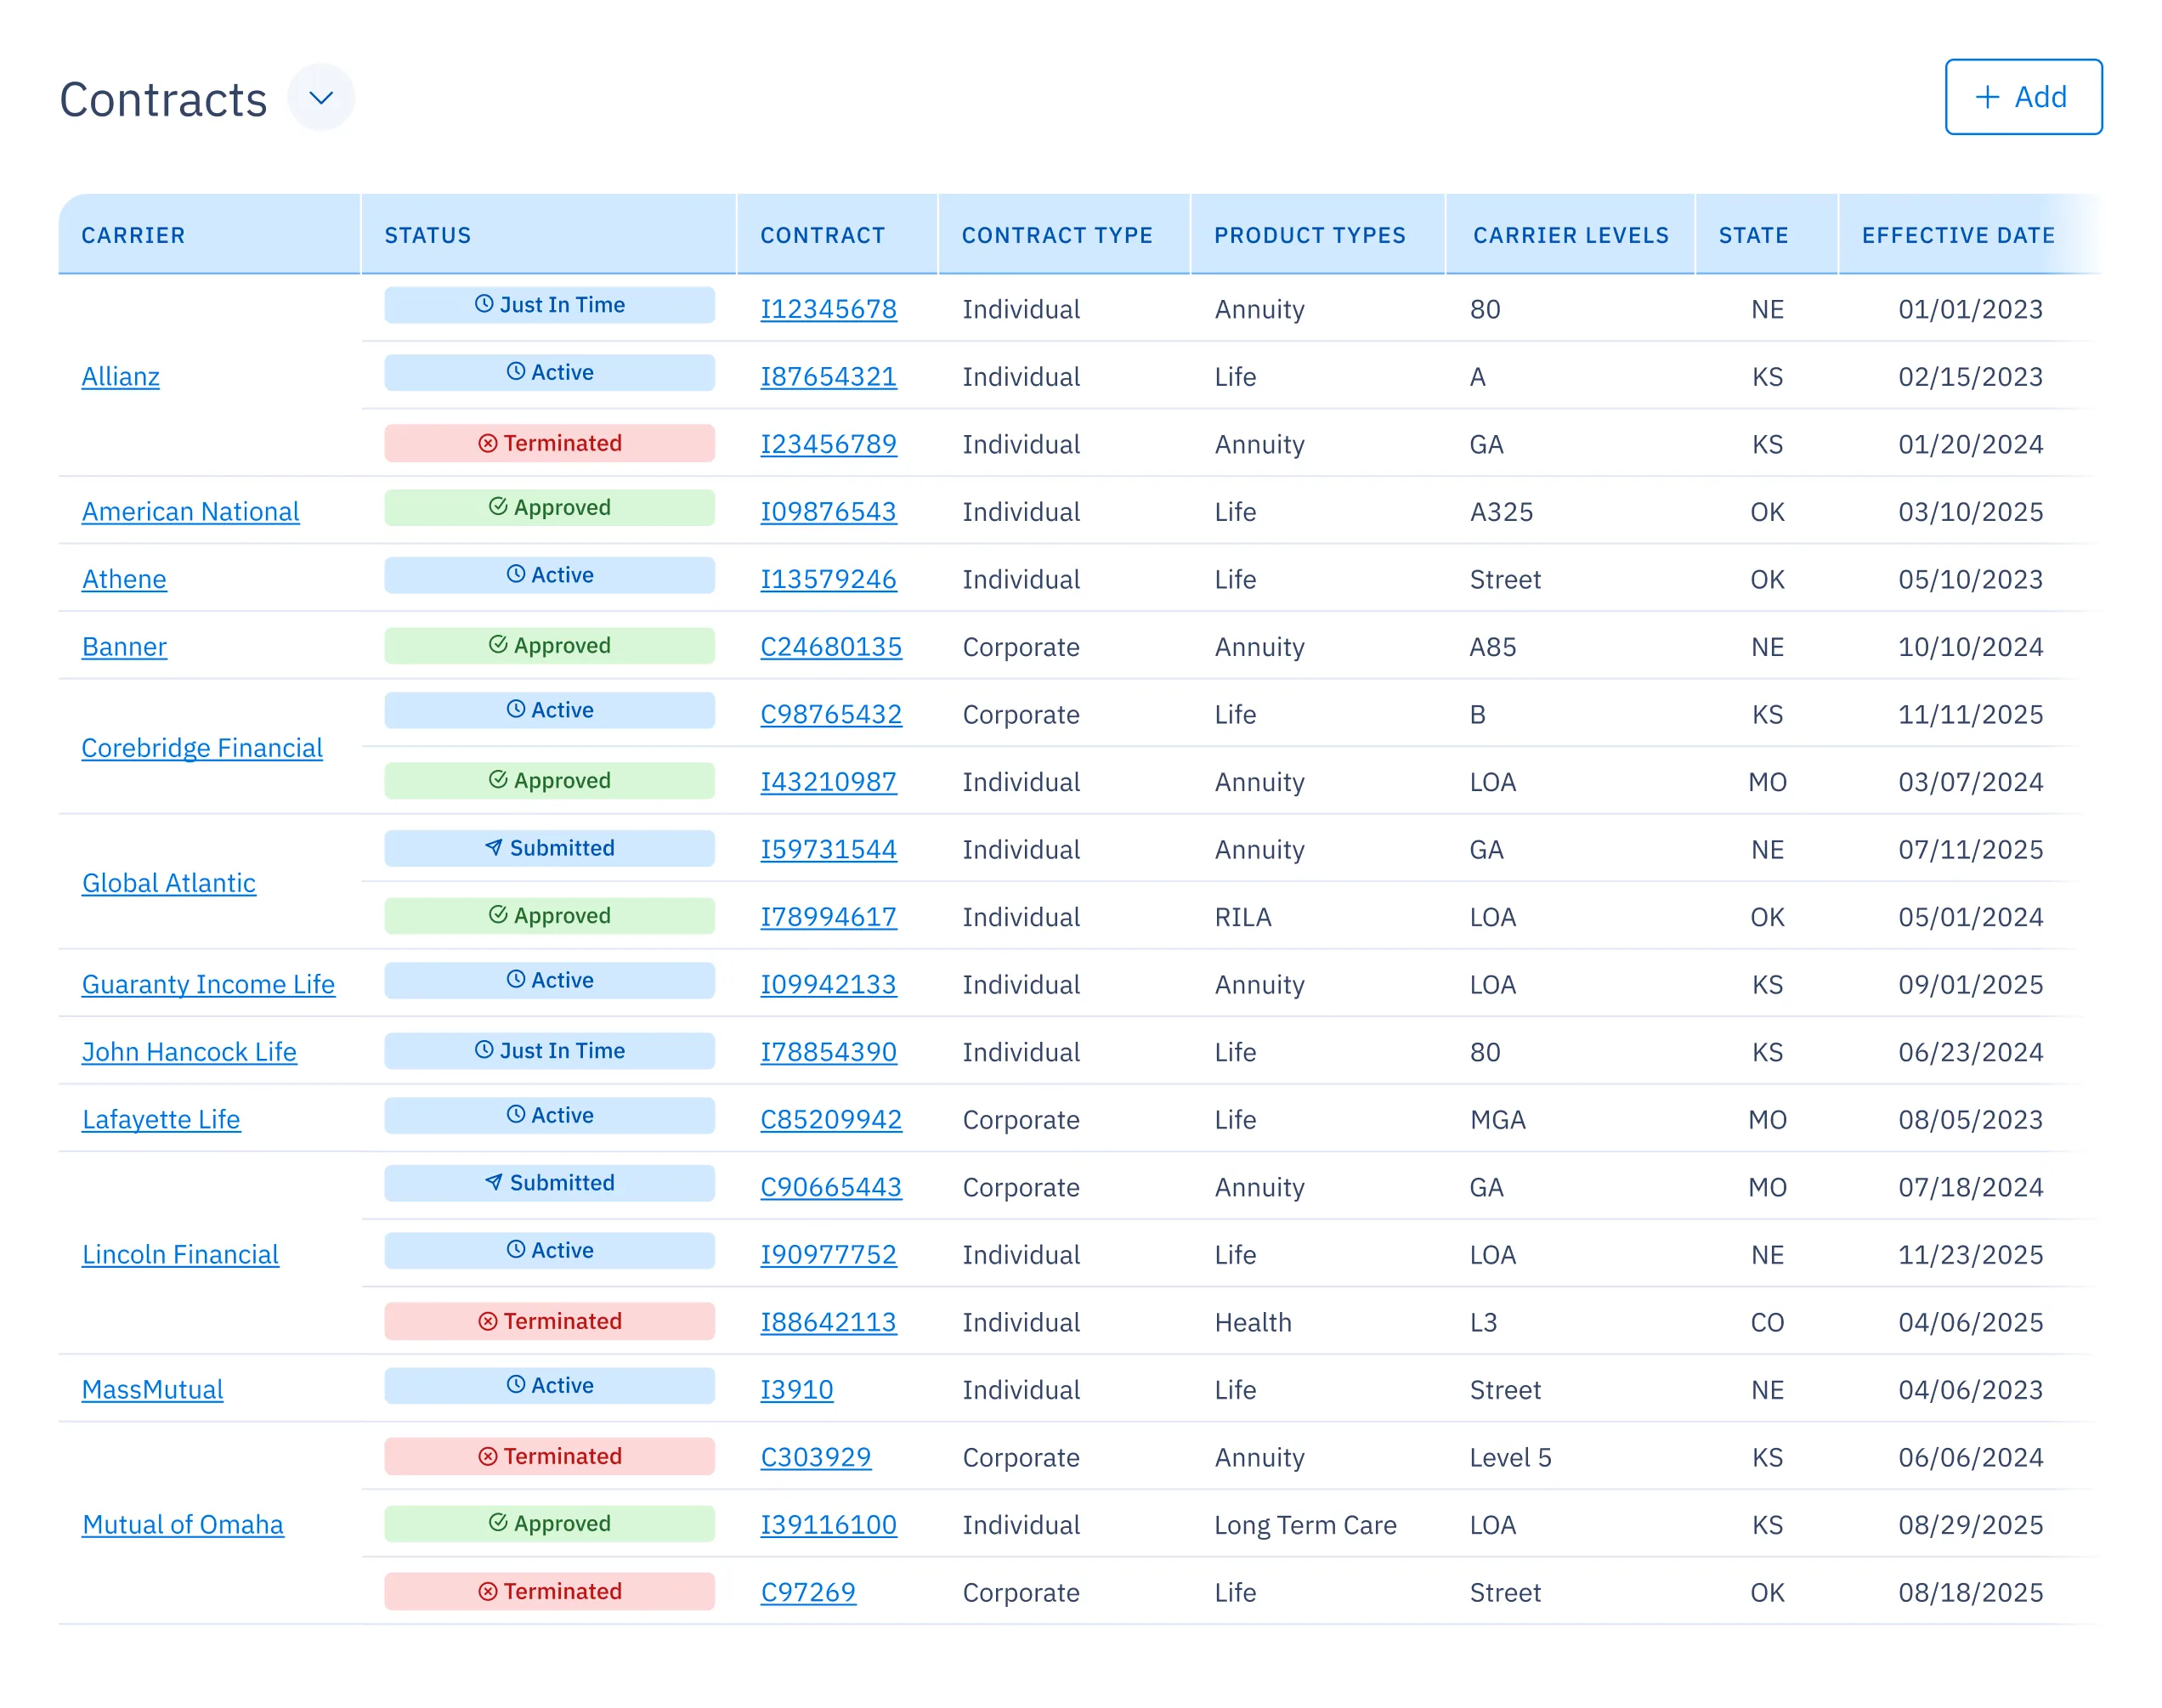
Easily view carrier, contracts and levels.
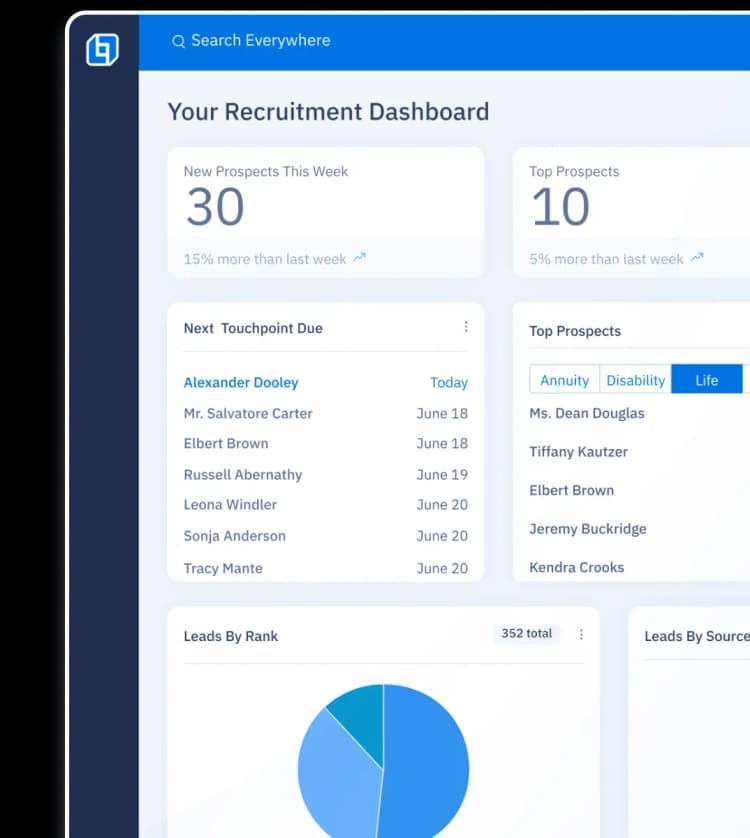
All agent data at your fingertips.

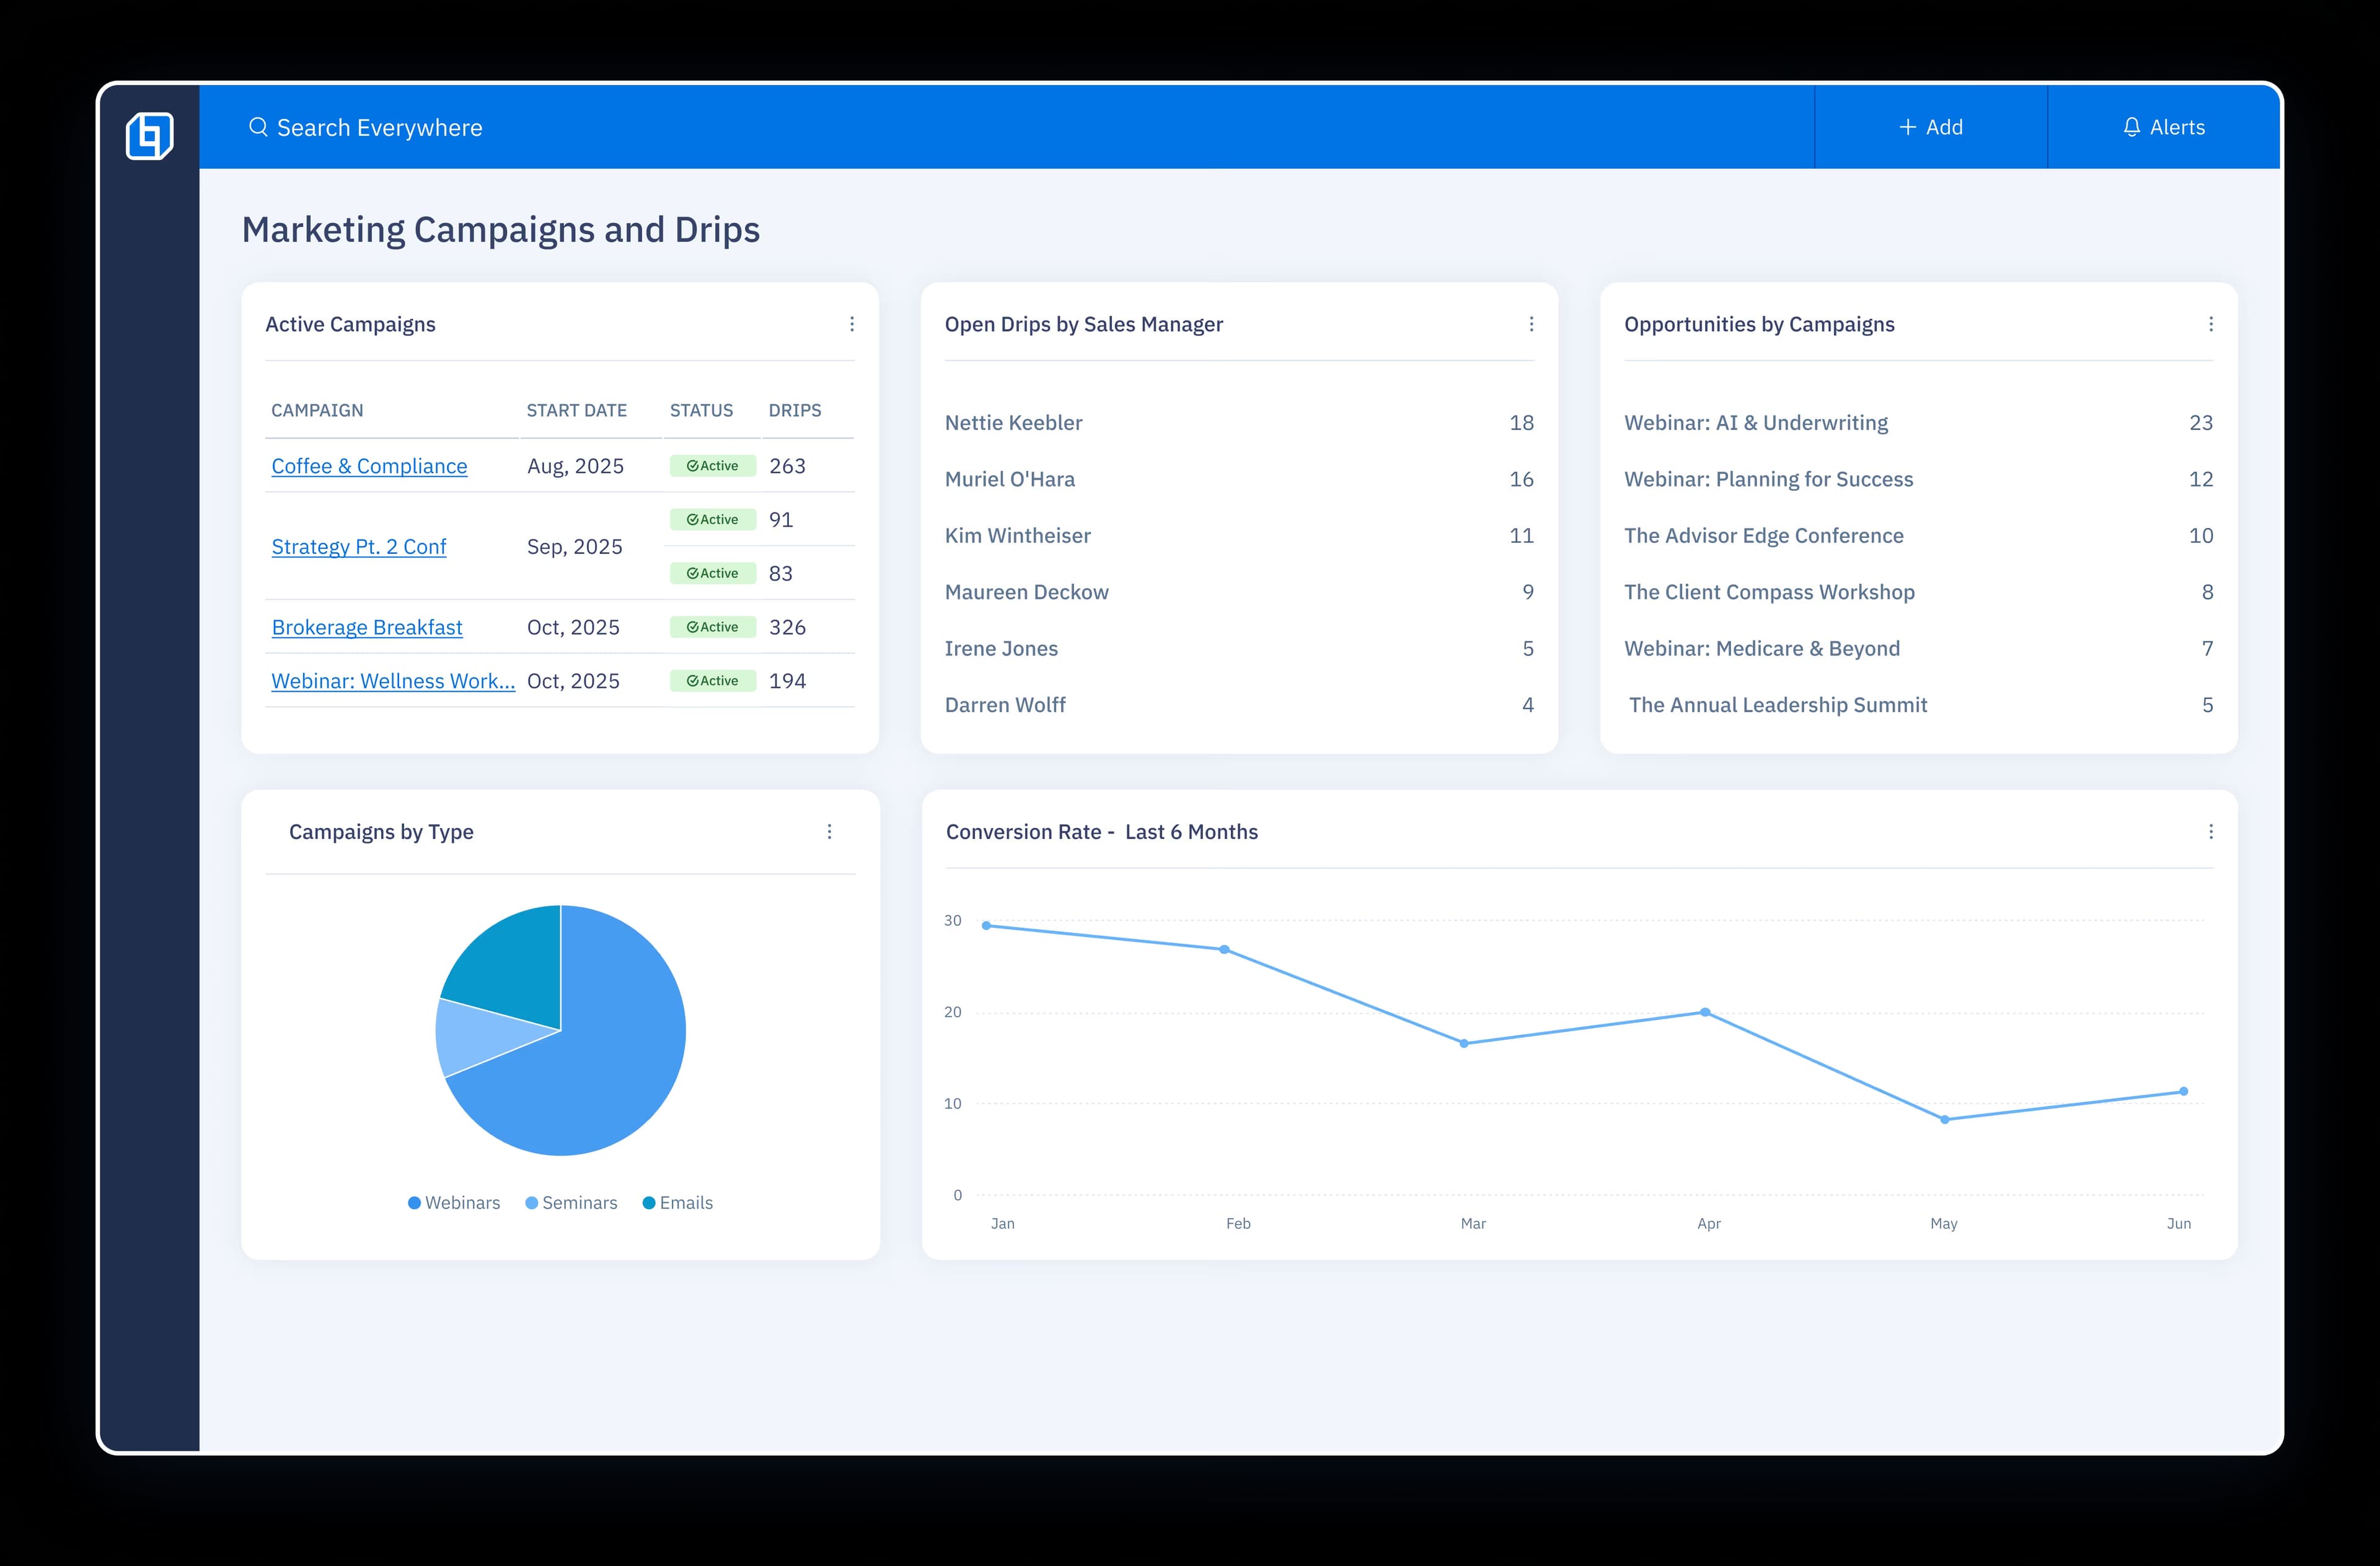
Campaigns that get results.

Campaigns that get results.
1
Set up your campaign.
Skip the busy work. Just pick your saved templates, customize your message and you’re ready to go.
2
Choose a targeted agent list.
Filter and select the right agents so your campaign lands where it matters most.
3
Work it.
Hit send and get results. Email blast, text message or power dial any list – all lightning fast.
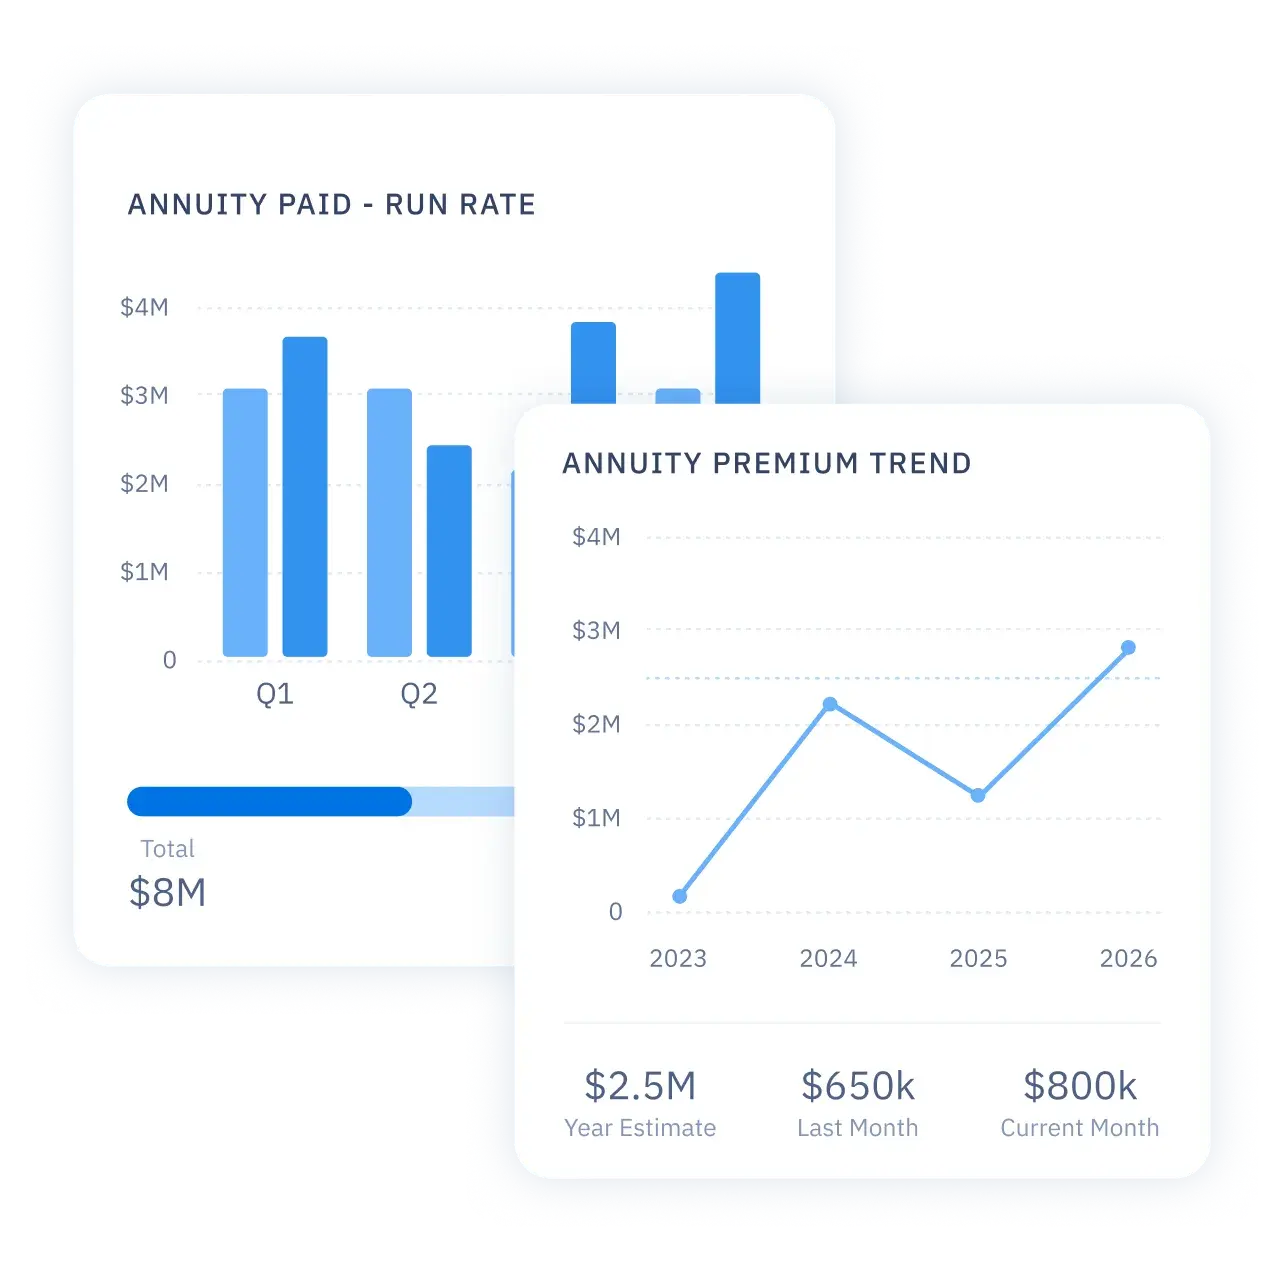
Track incentive programs, trips and marketing credits.
DISCOVER ICM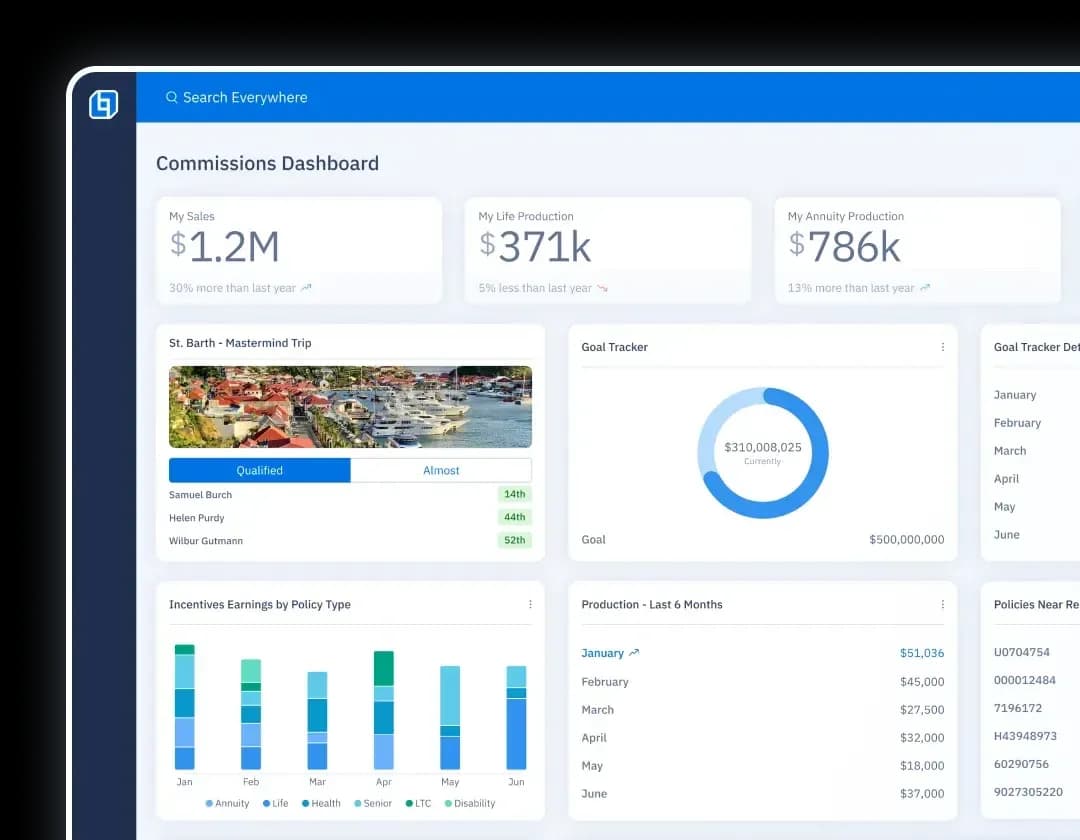
Keep sales moving.
Pipeline
Keep every deal moving forward in a visual pipeline, so you always know what needs attention.
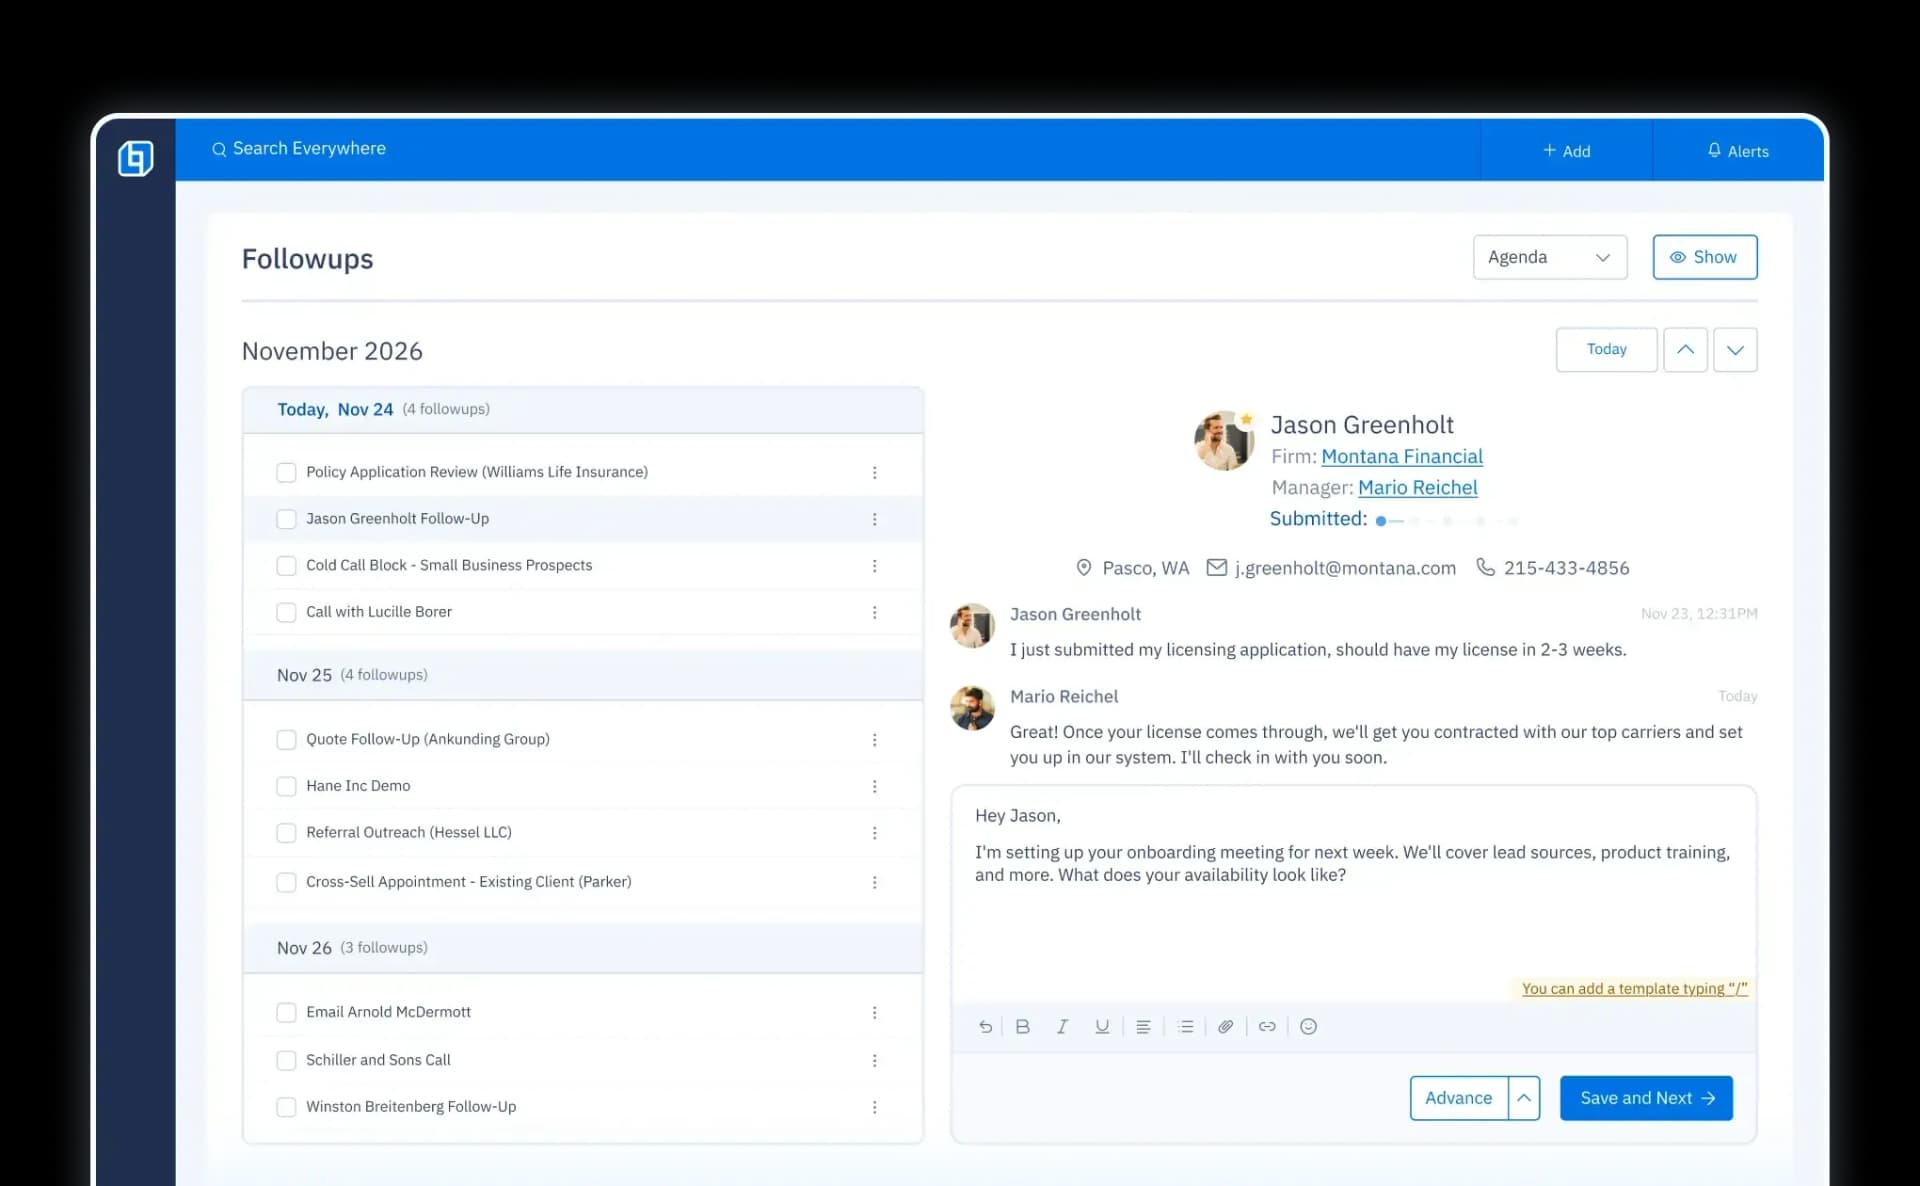
Follow-ups
Get reminders to stay in contact with top agents and prospects.
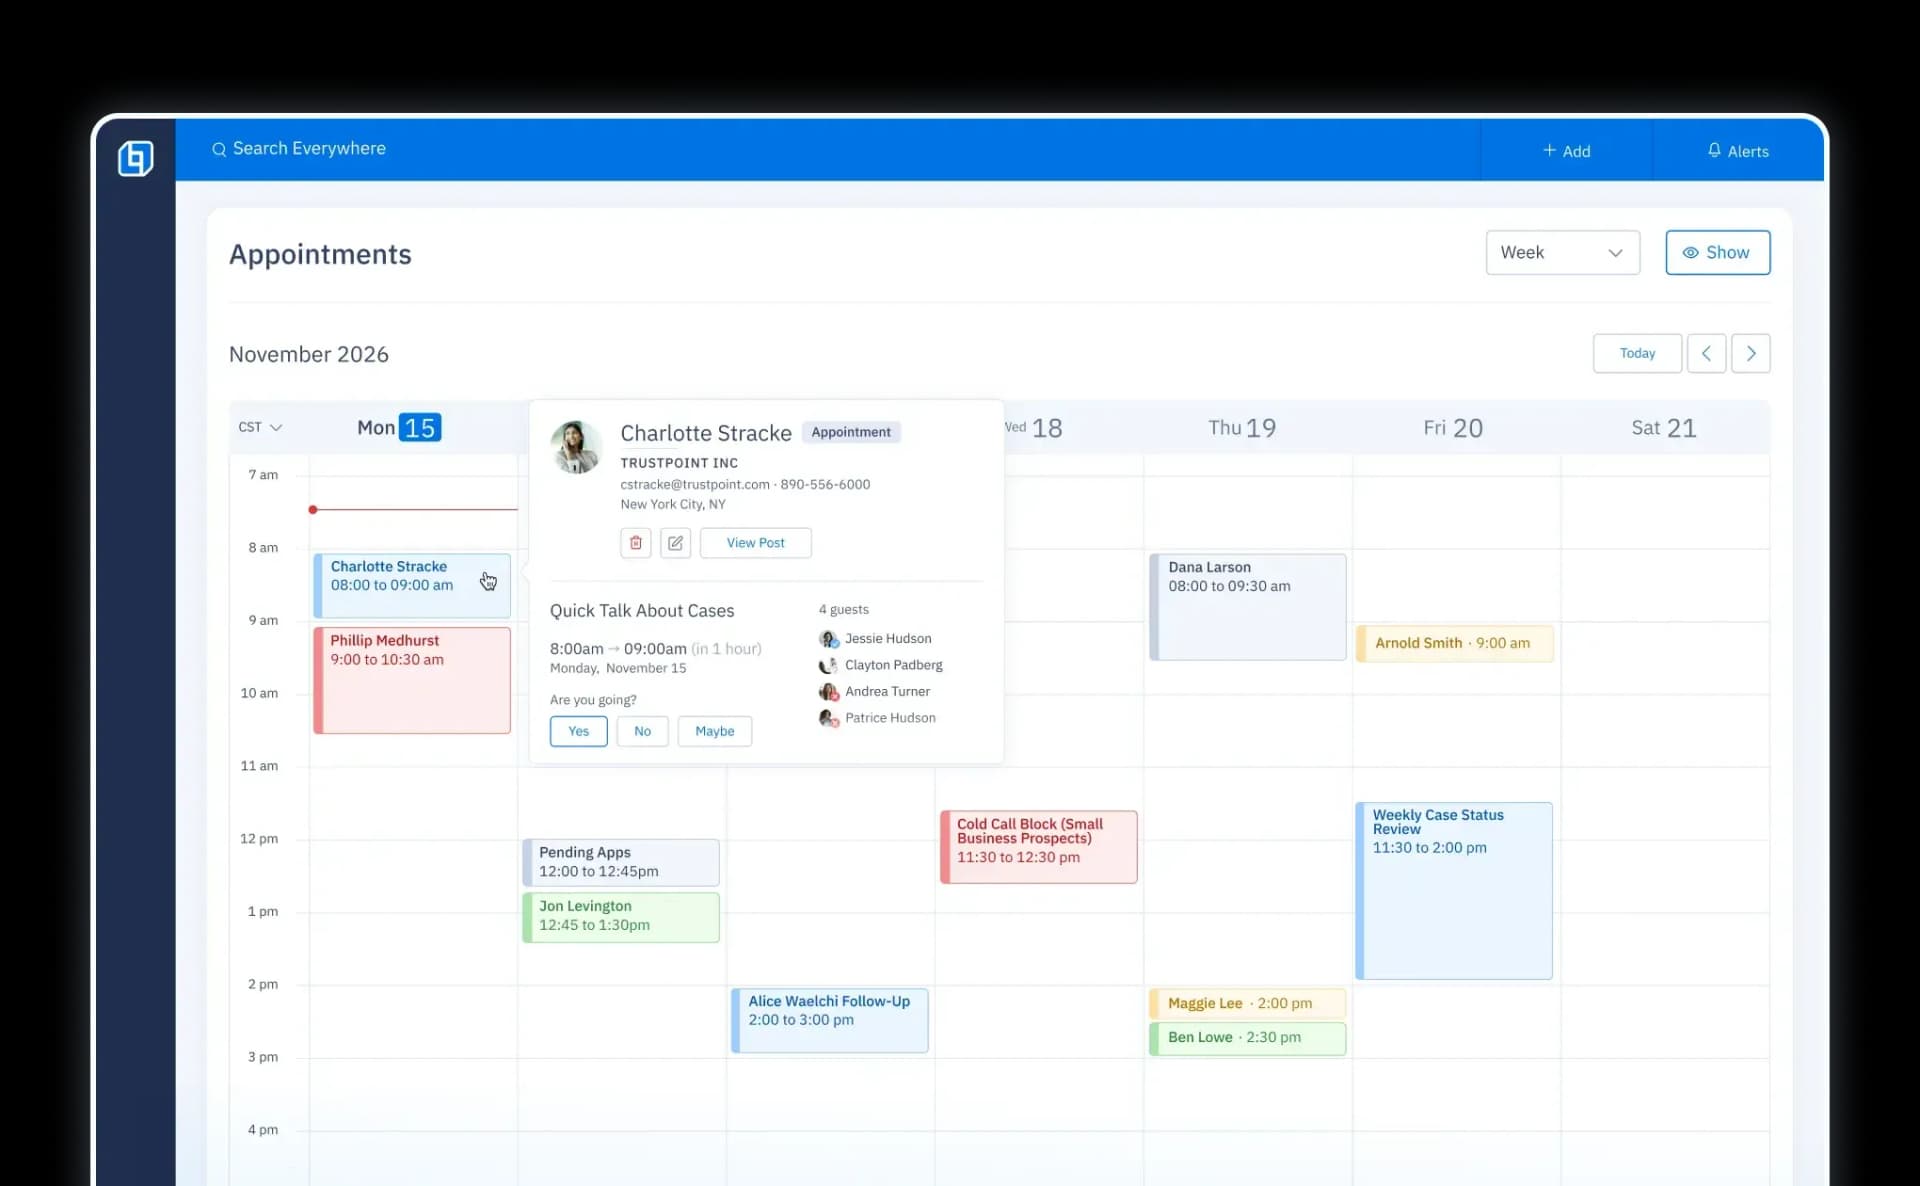
Calendar
Sync your calendar to easily schedule meetings, subscribe to the company marketing calendar and track rate changes – all in one view.

.webp&w=1080&q=75)
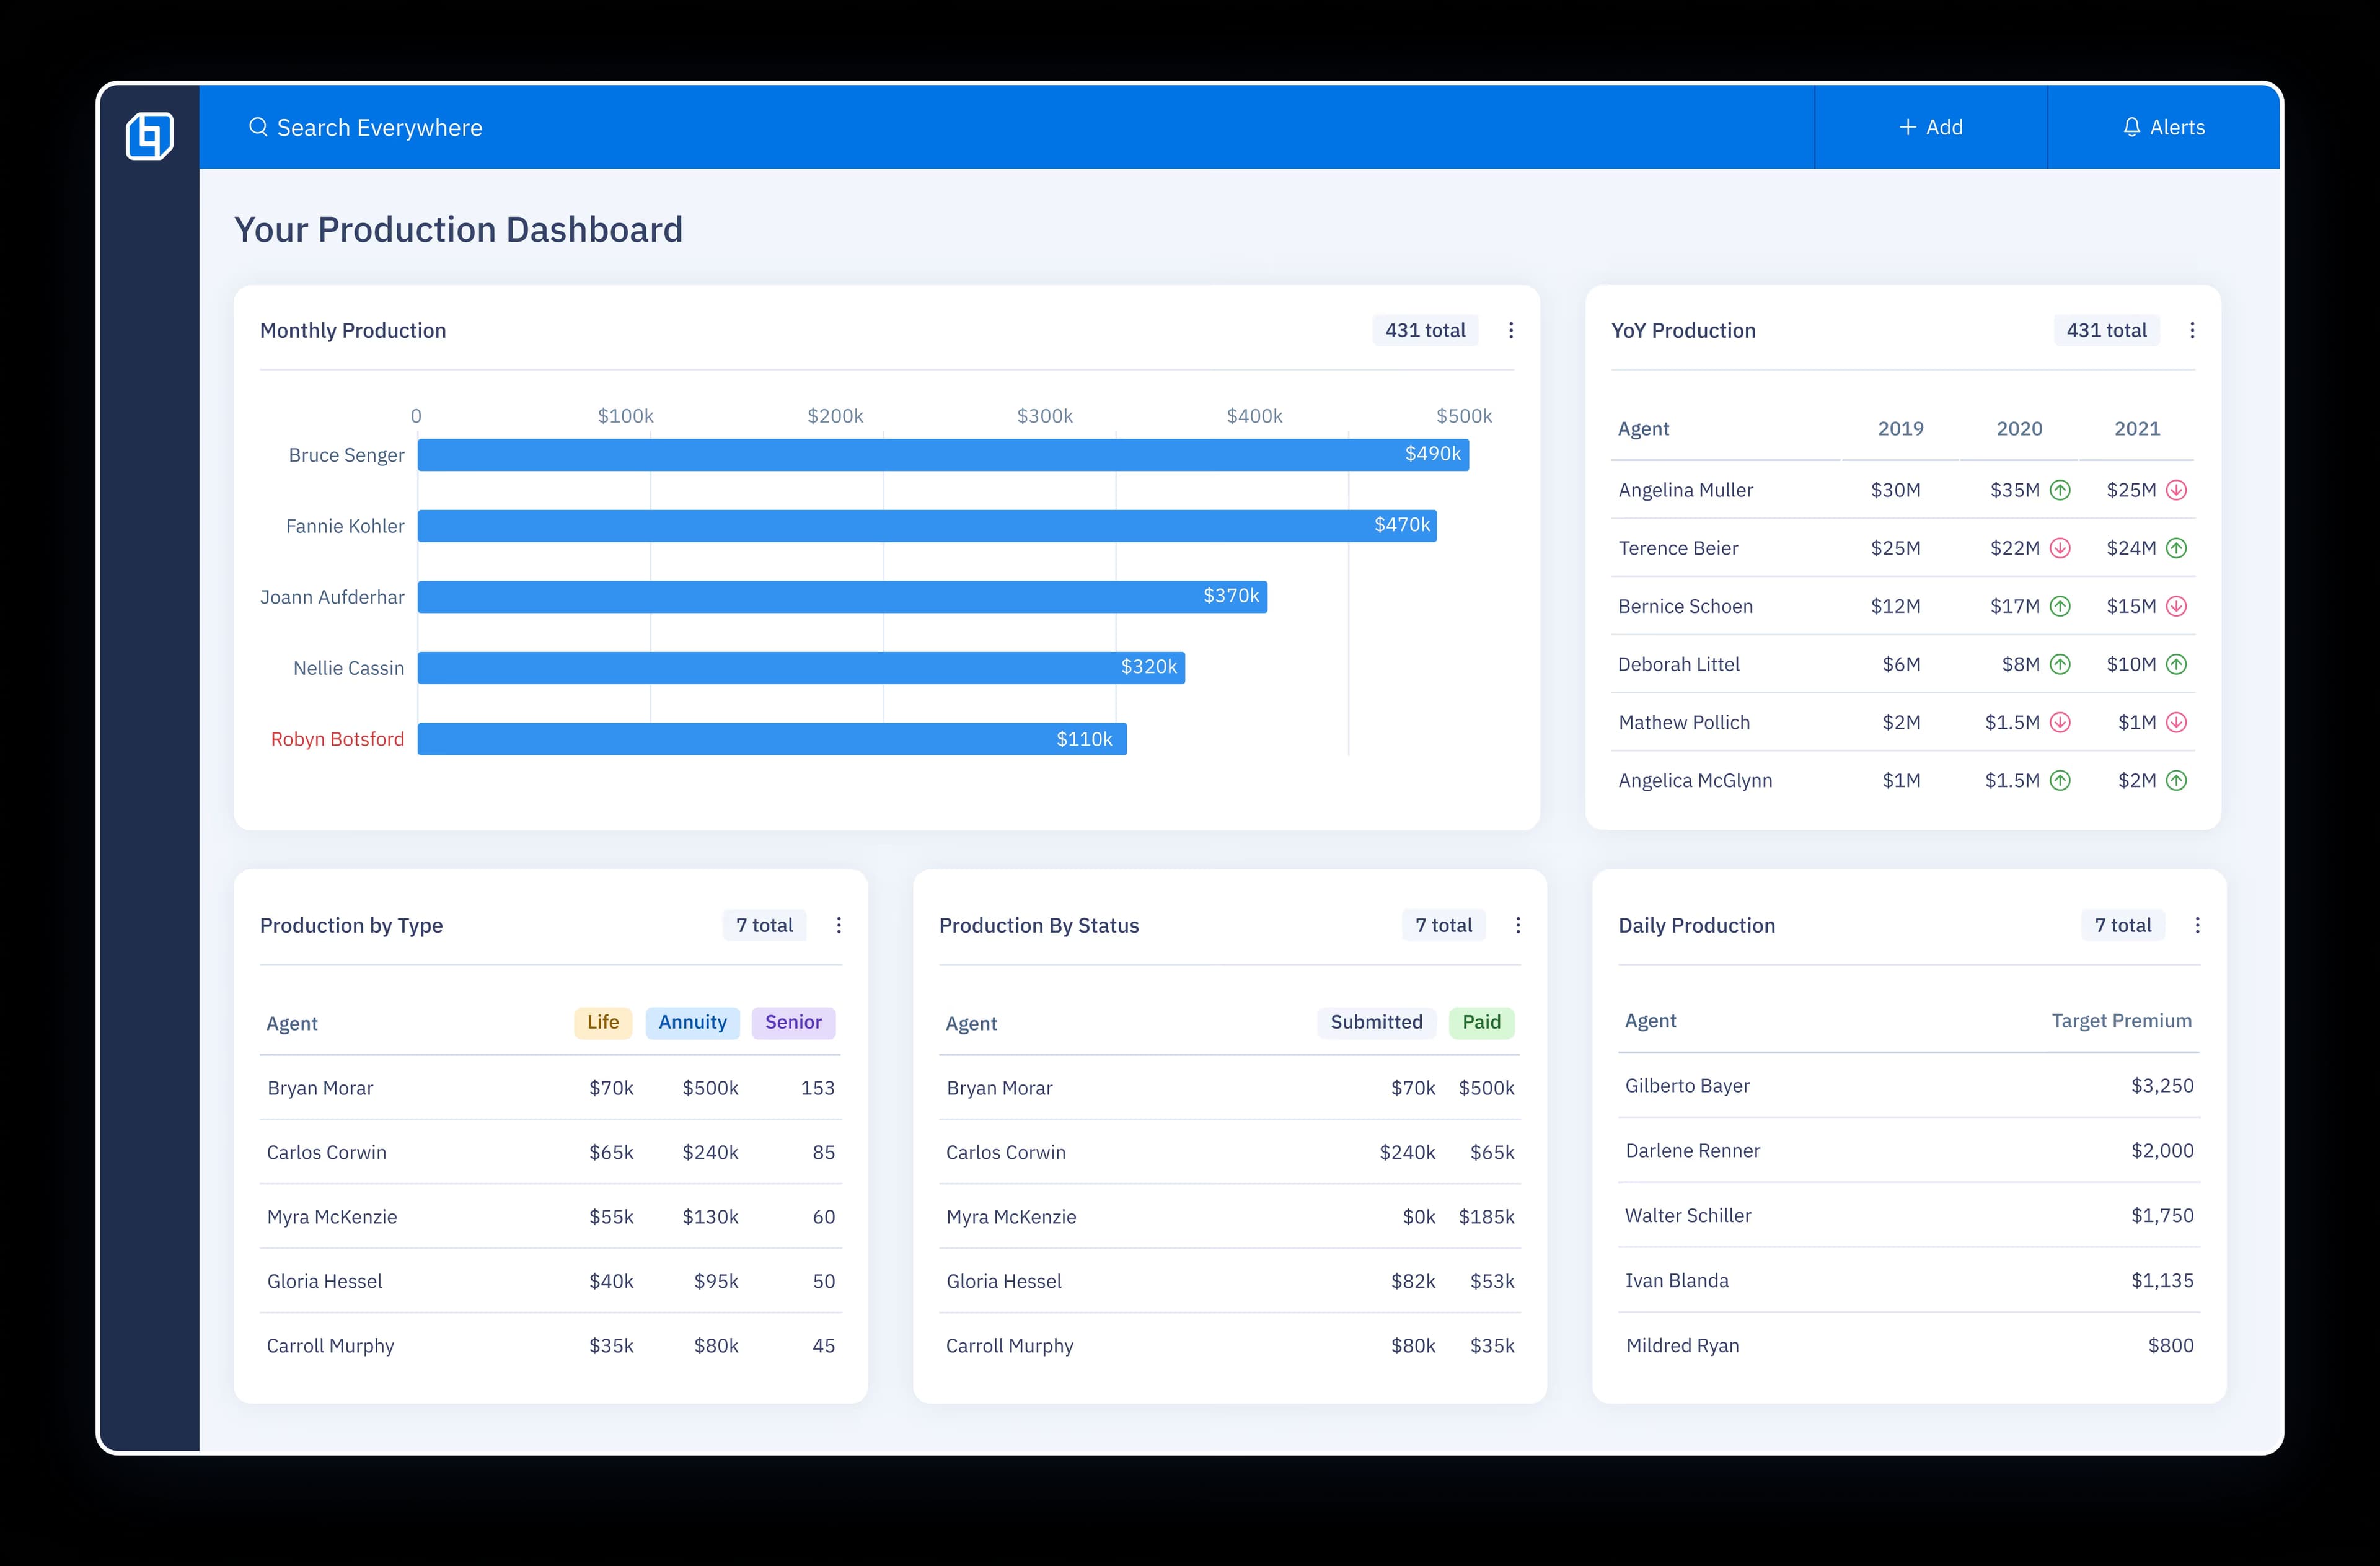
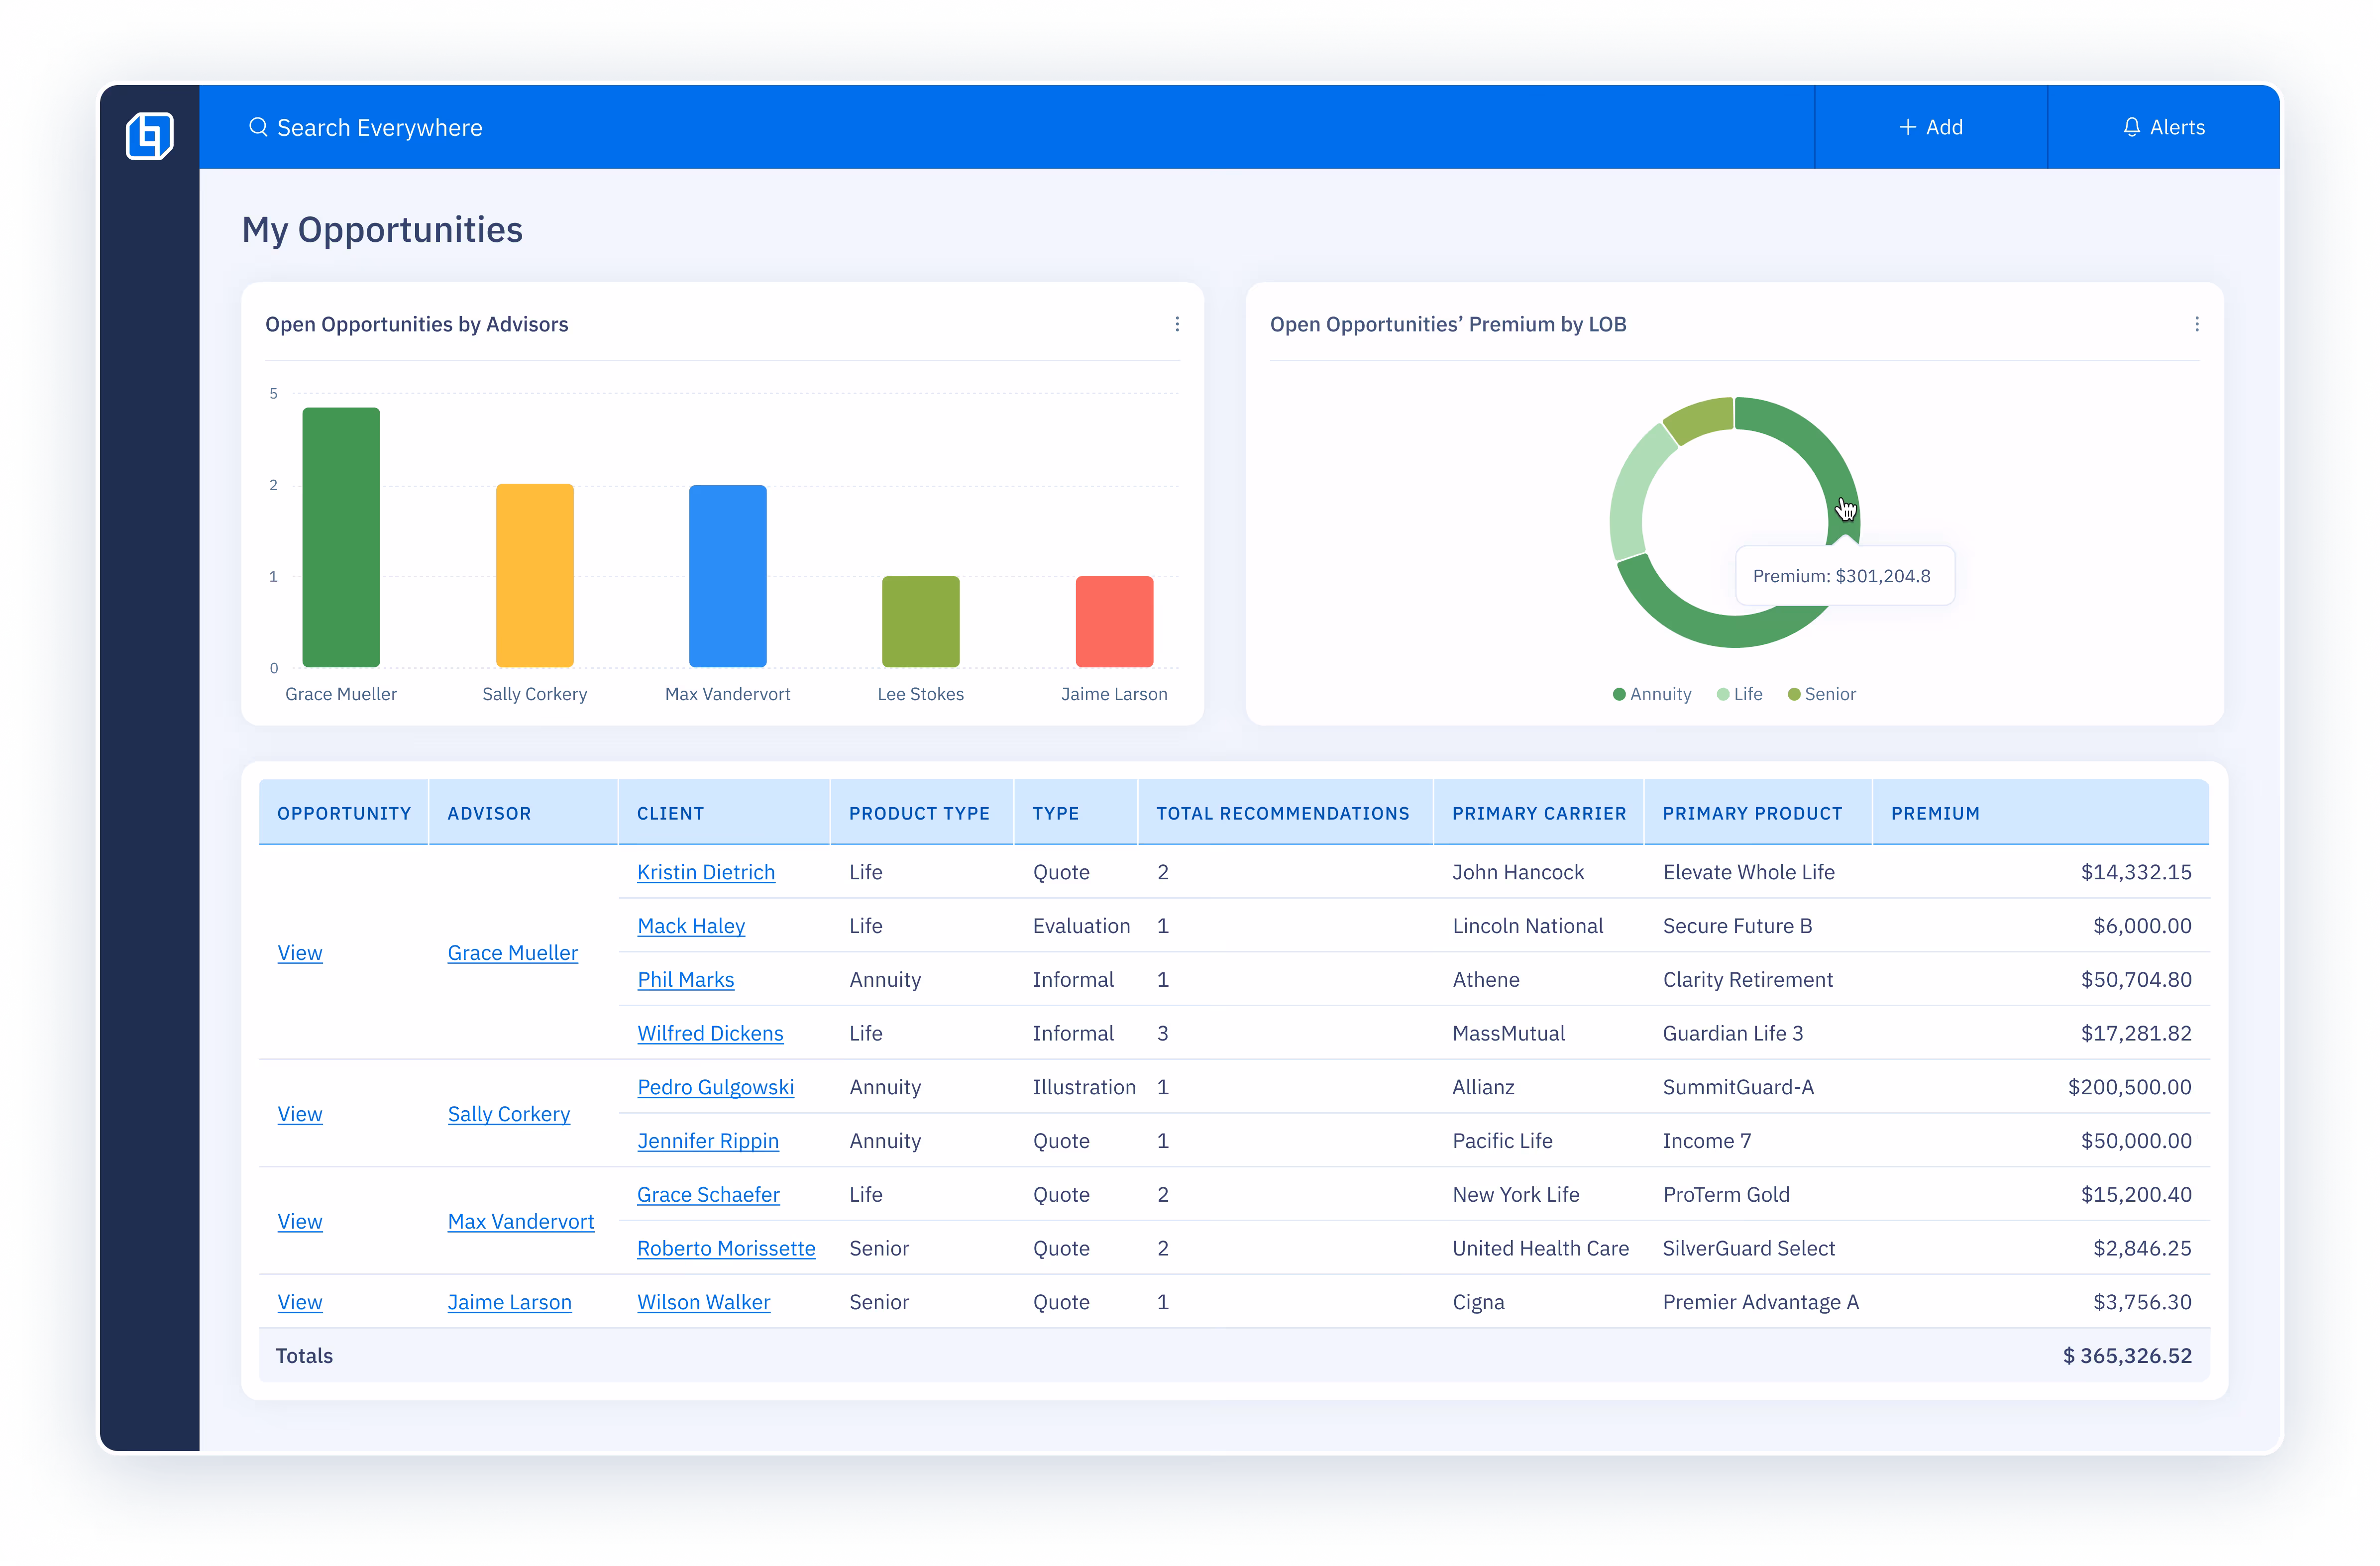
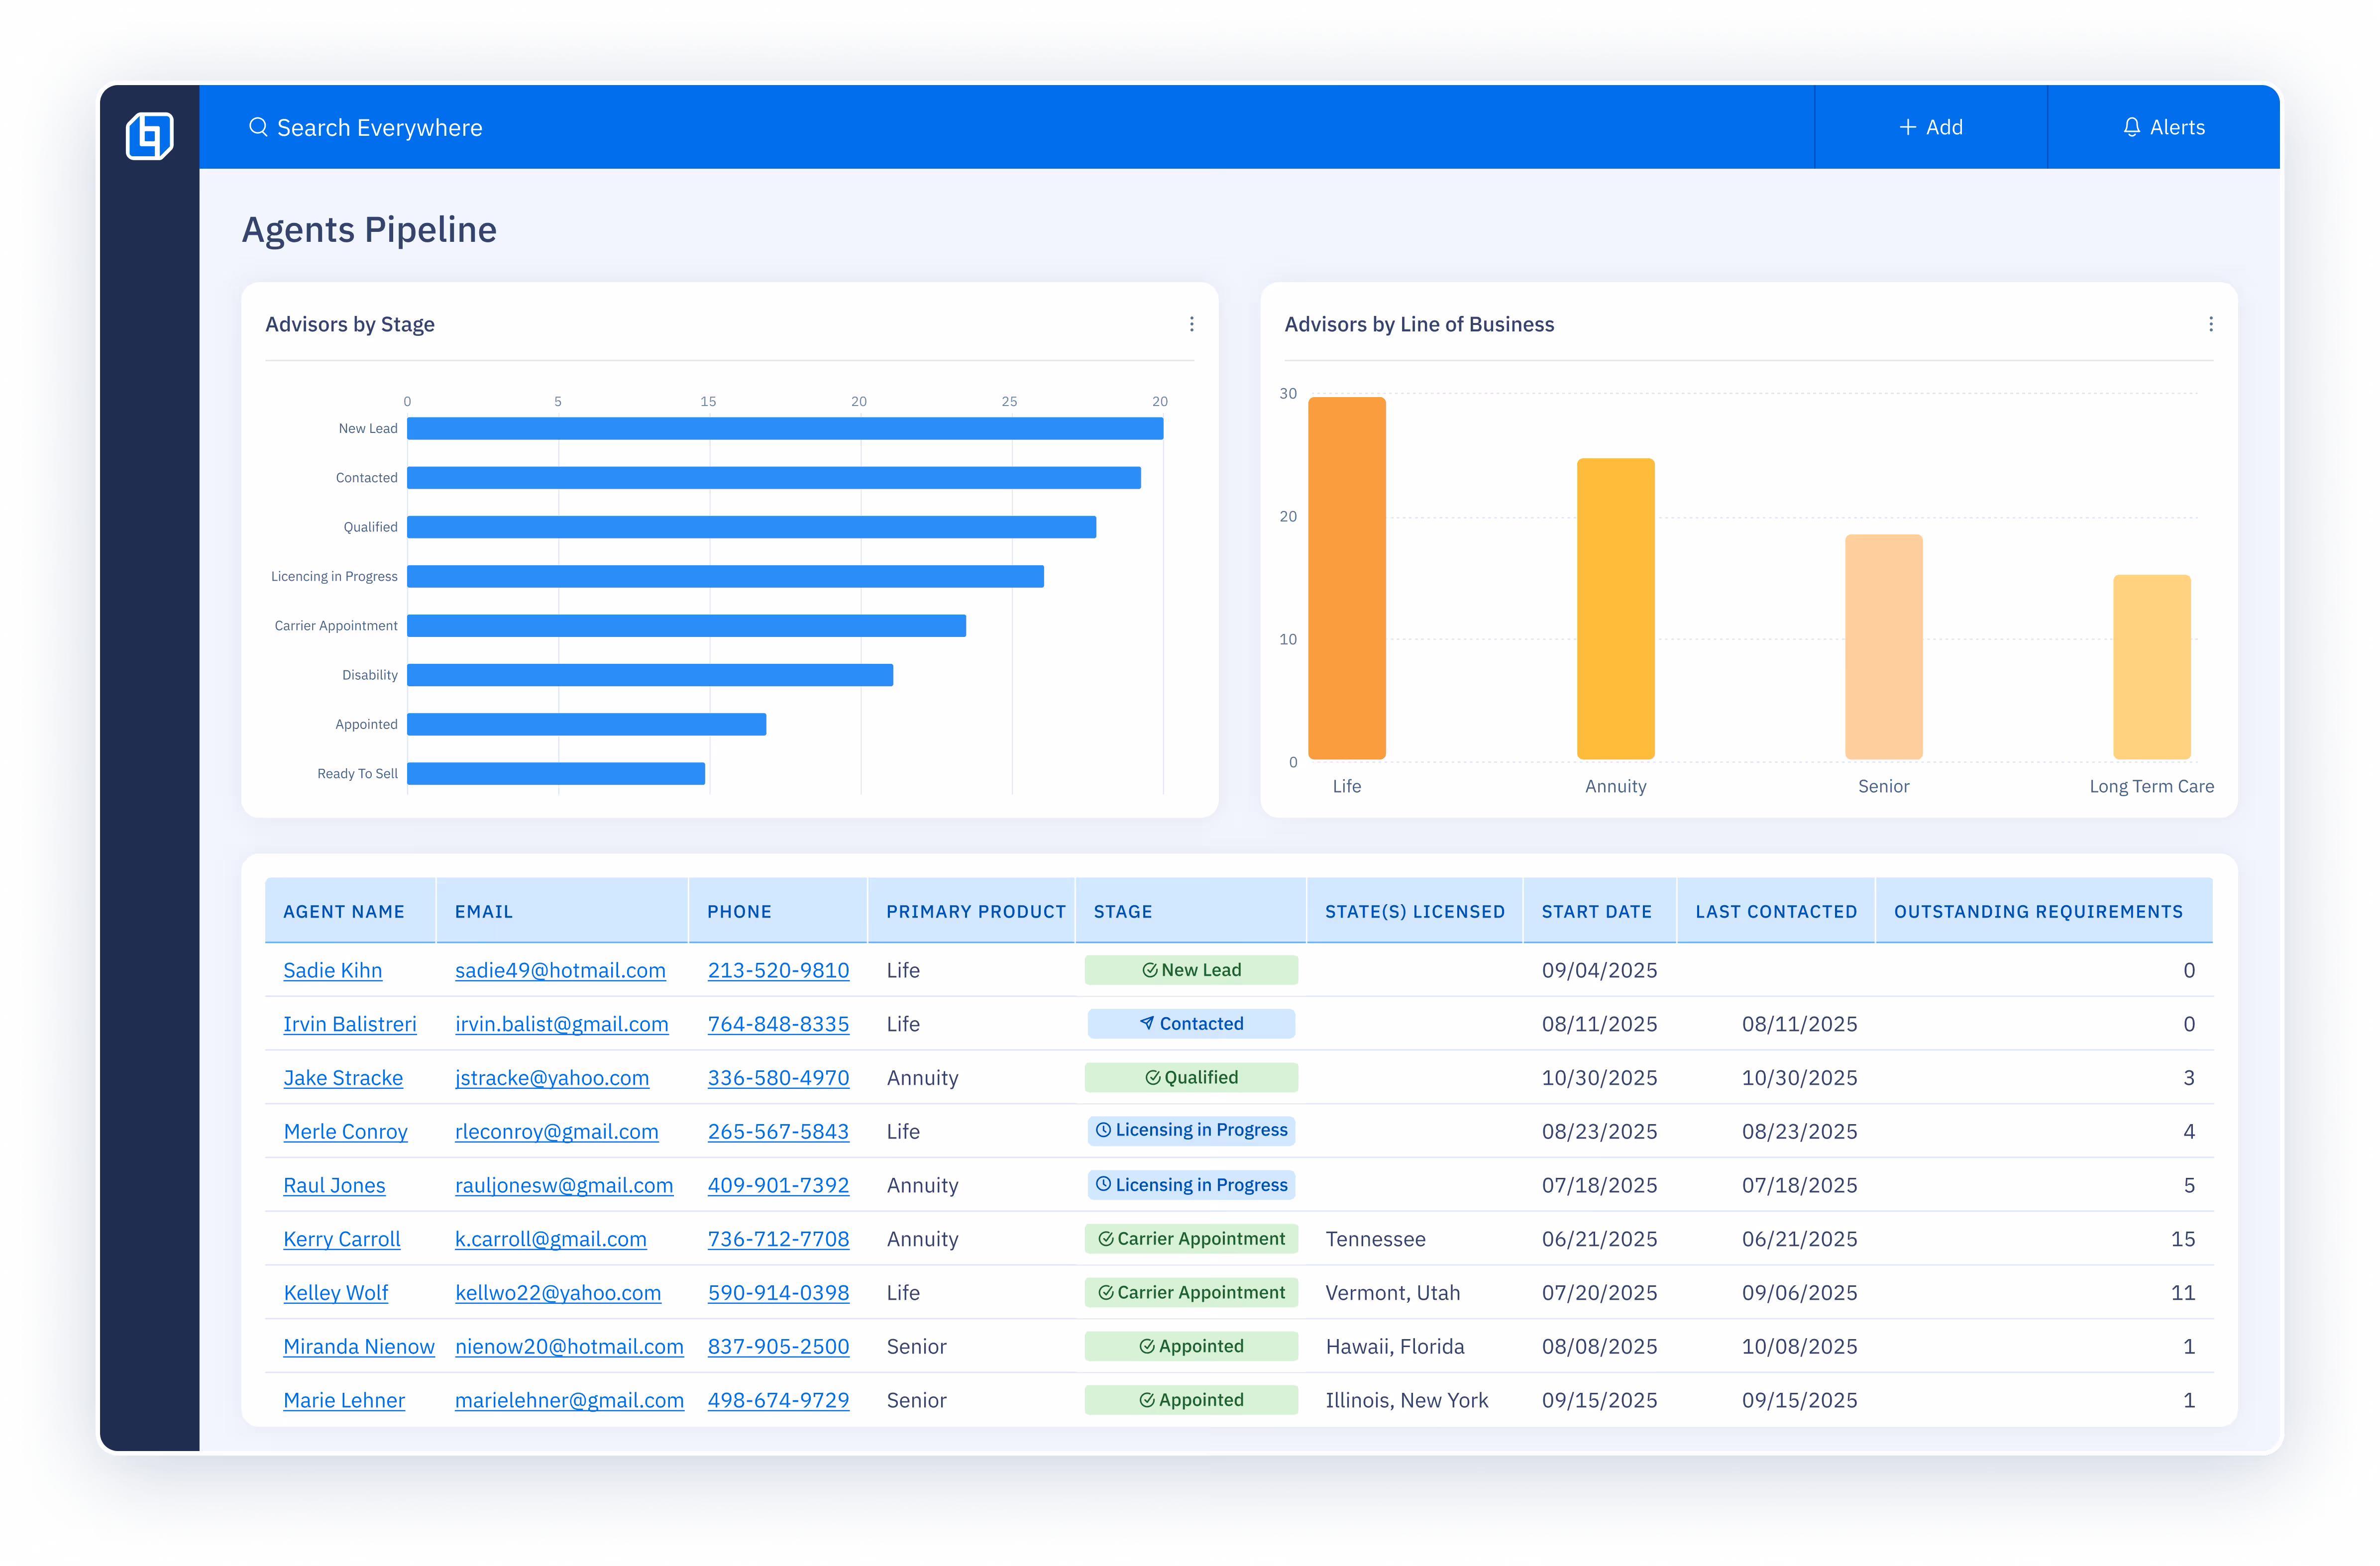
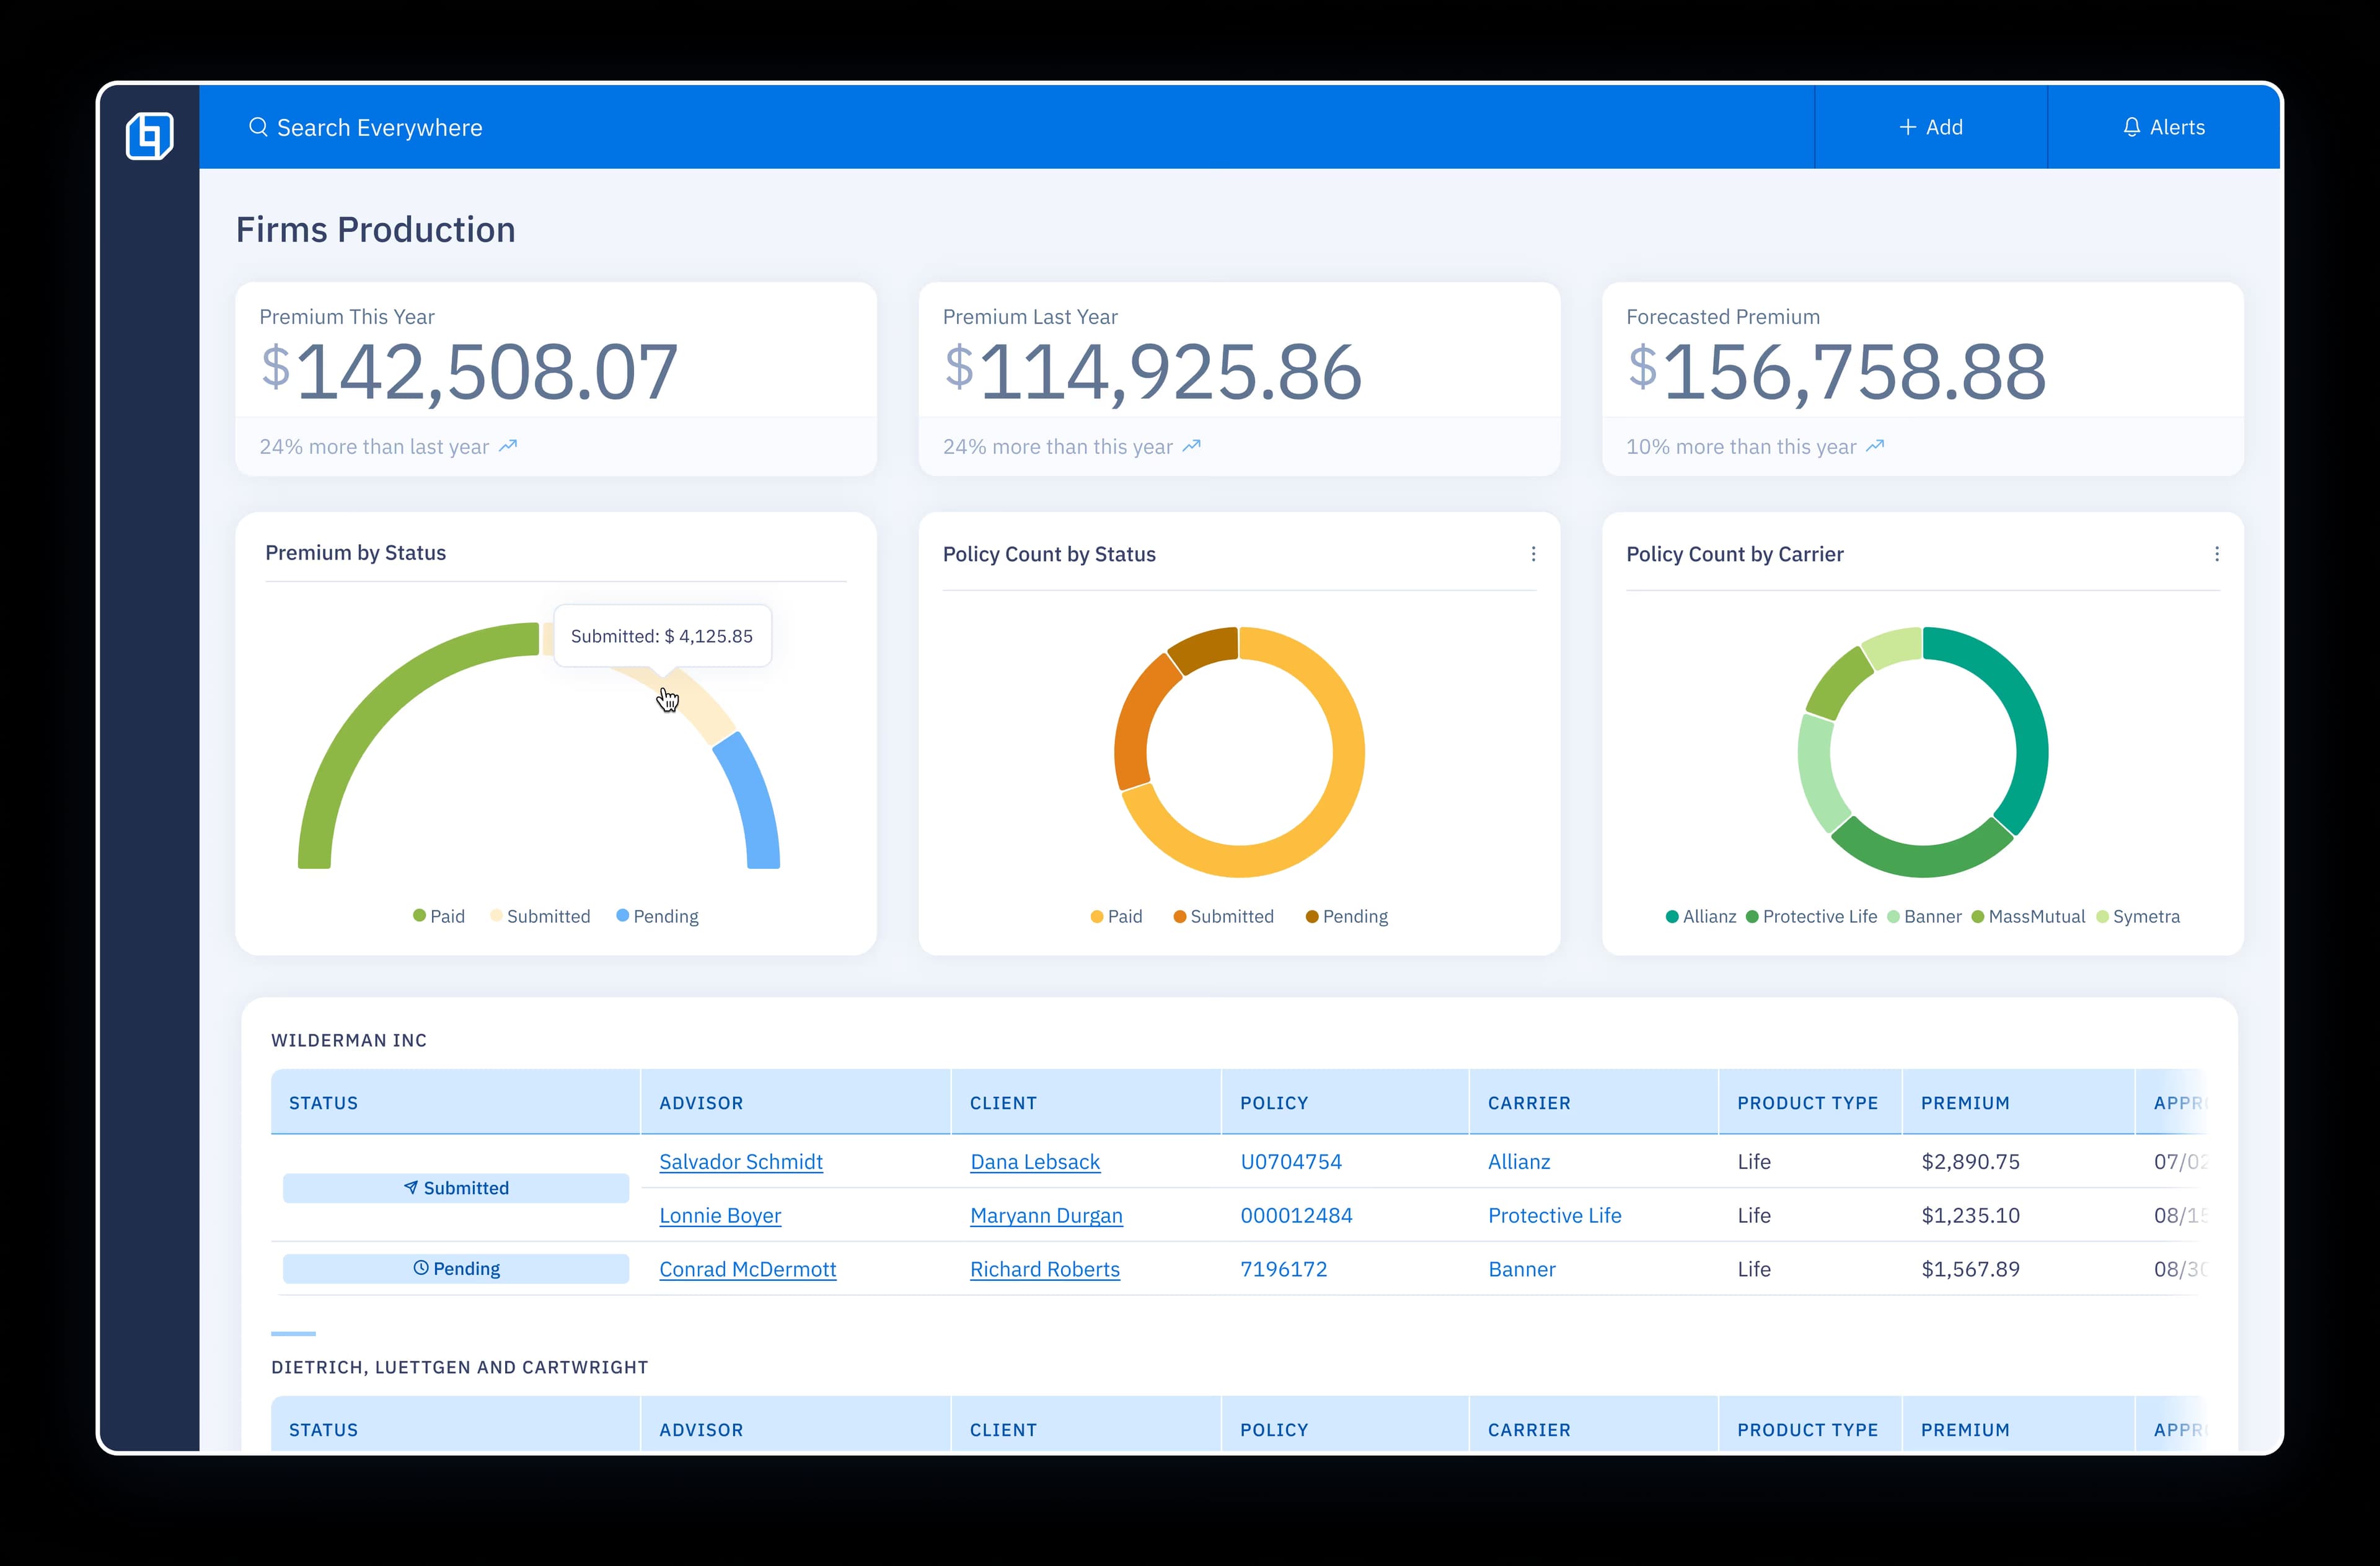
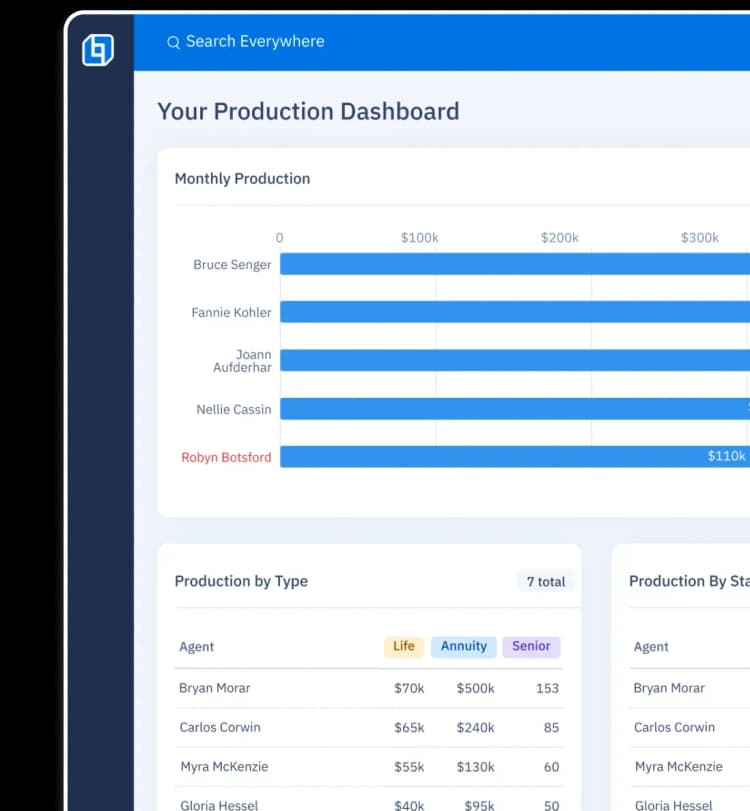
Reports & Dashboards
Data that works for you (for a change).

Insuritect
“OneHQ really helps my sales team stay on task and get the follow ups that they need to get a prospect to cross the finish line.”
Justin Snapp | CEO
Launch: Go Live in 3 Steps
Our proven process has had over 100 successful launches, you can trust us to get it right. Regardless of your previous experiences, there is no need to stress—we are your technology partner for life.
1
Discovery
We listen to your problems and we demonstrate the solutions to ensure we're a good fit.
2
Onboarding
We convert 100% of your data, train your team and customize the platform so the transition is not disruptive.
3
Scale
Going Live is just the beginning; our technology and industry experts ensure your business maximizes the use of technology into the future.


All-in-one platform for Insurance Distribution.
DMS
A Distribution Management System that works for you.
ICM
Incentives & Commissions Management built for profit.
Data Visualization
Data that works
for you.
Agent Portal
An Agent Portal built for professional service.
CRM
A CRM built for Insurance Distribution.
DMS
A Distribution Management System that works for you.
ICM
Incentives & Commissions Management built for profit.
Data Visualization
Data that works
for you.
Agent Portal
An Agent Portal built for professional service.