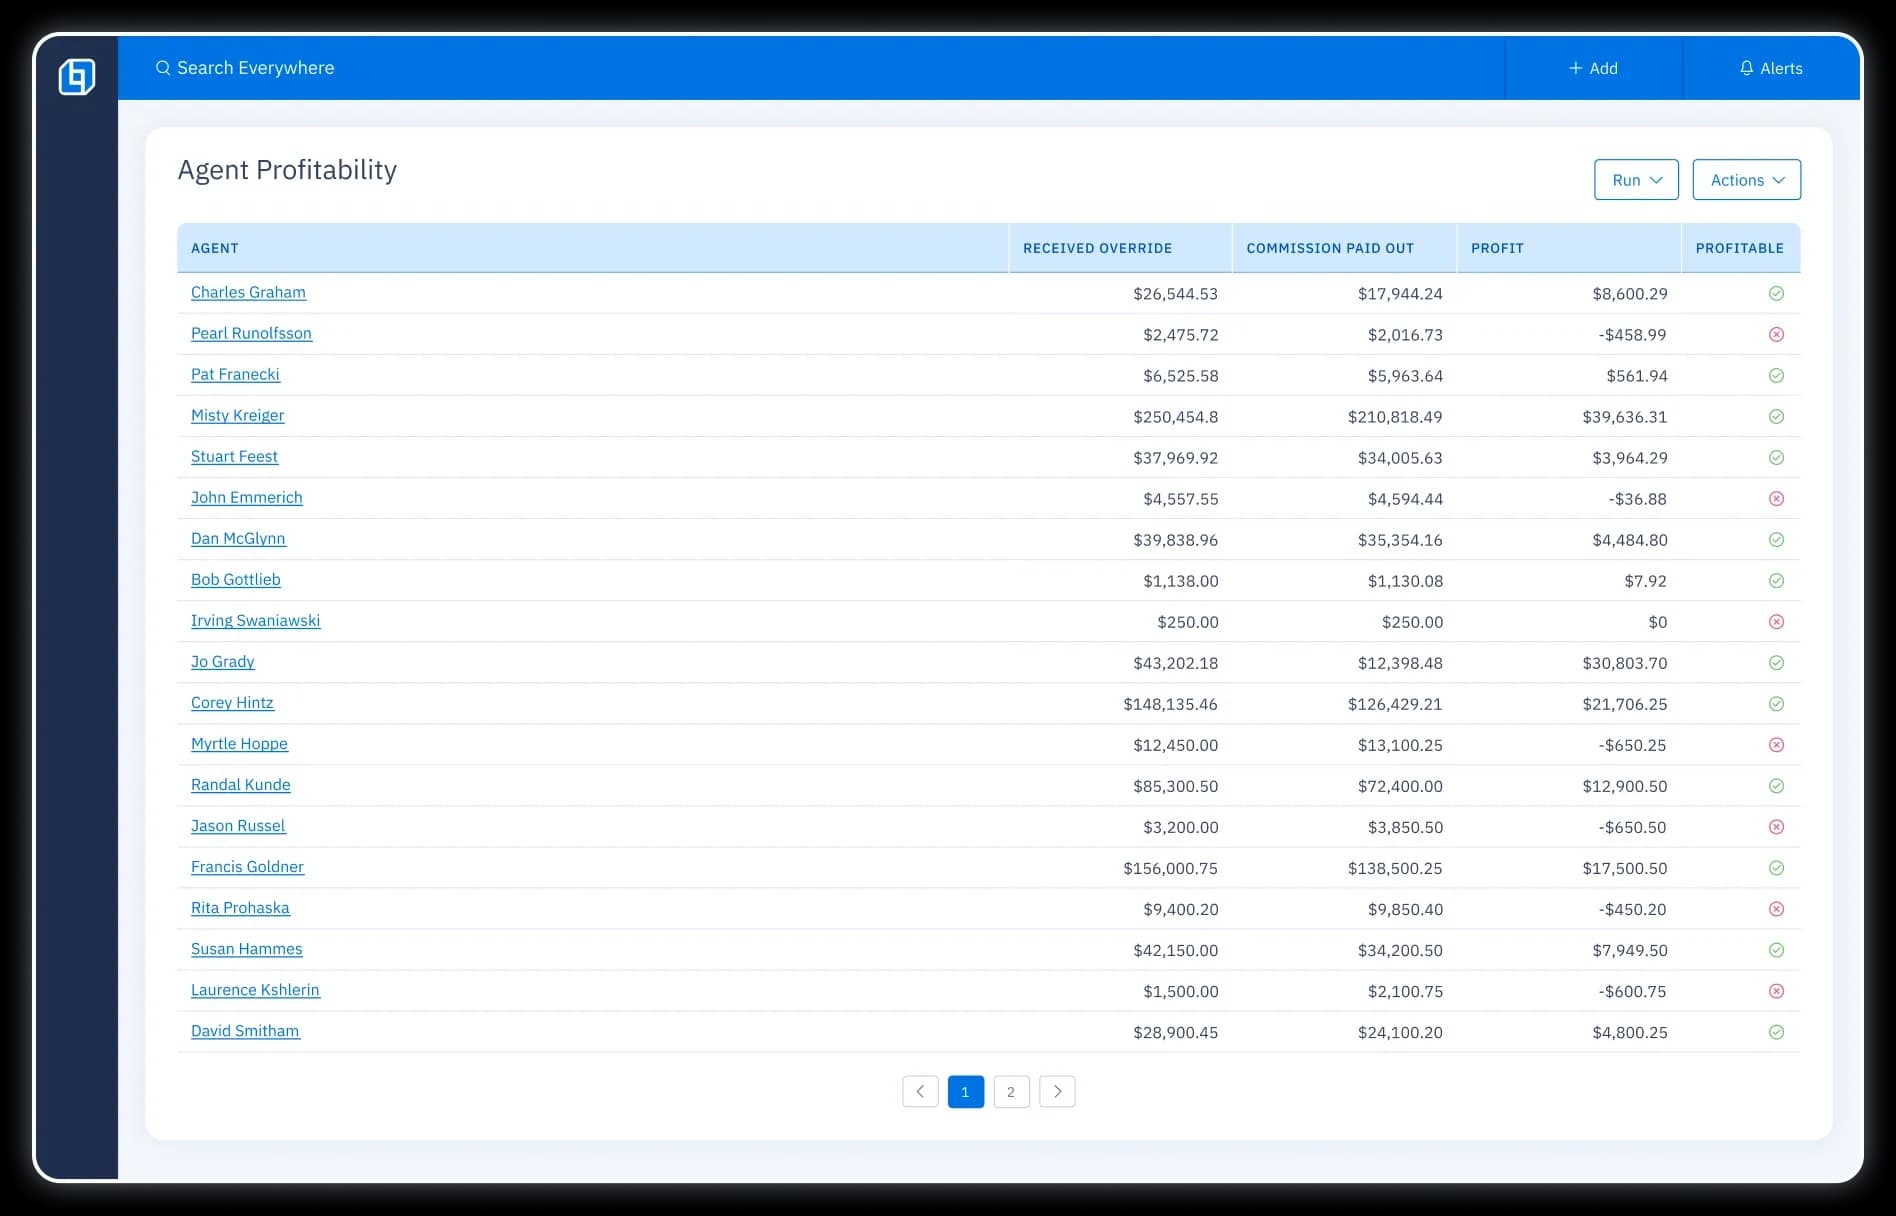
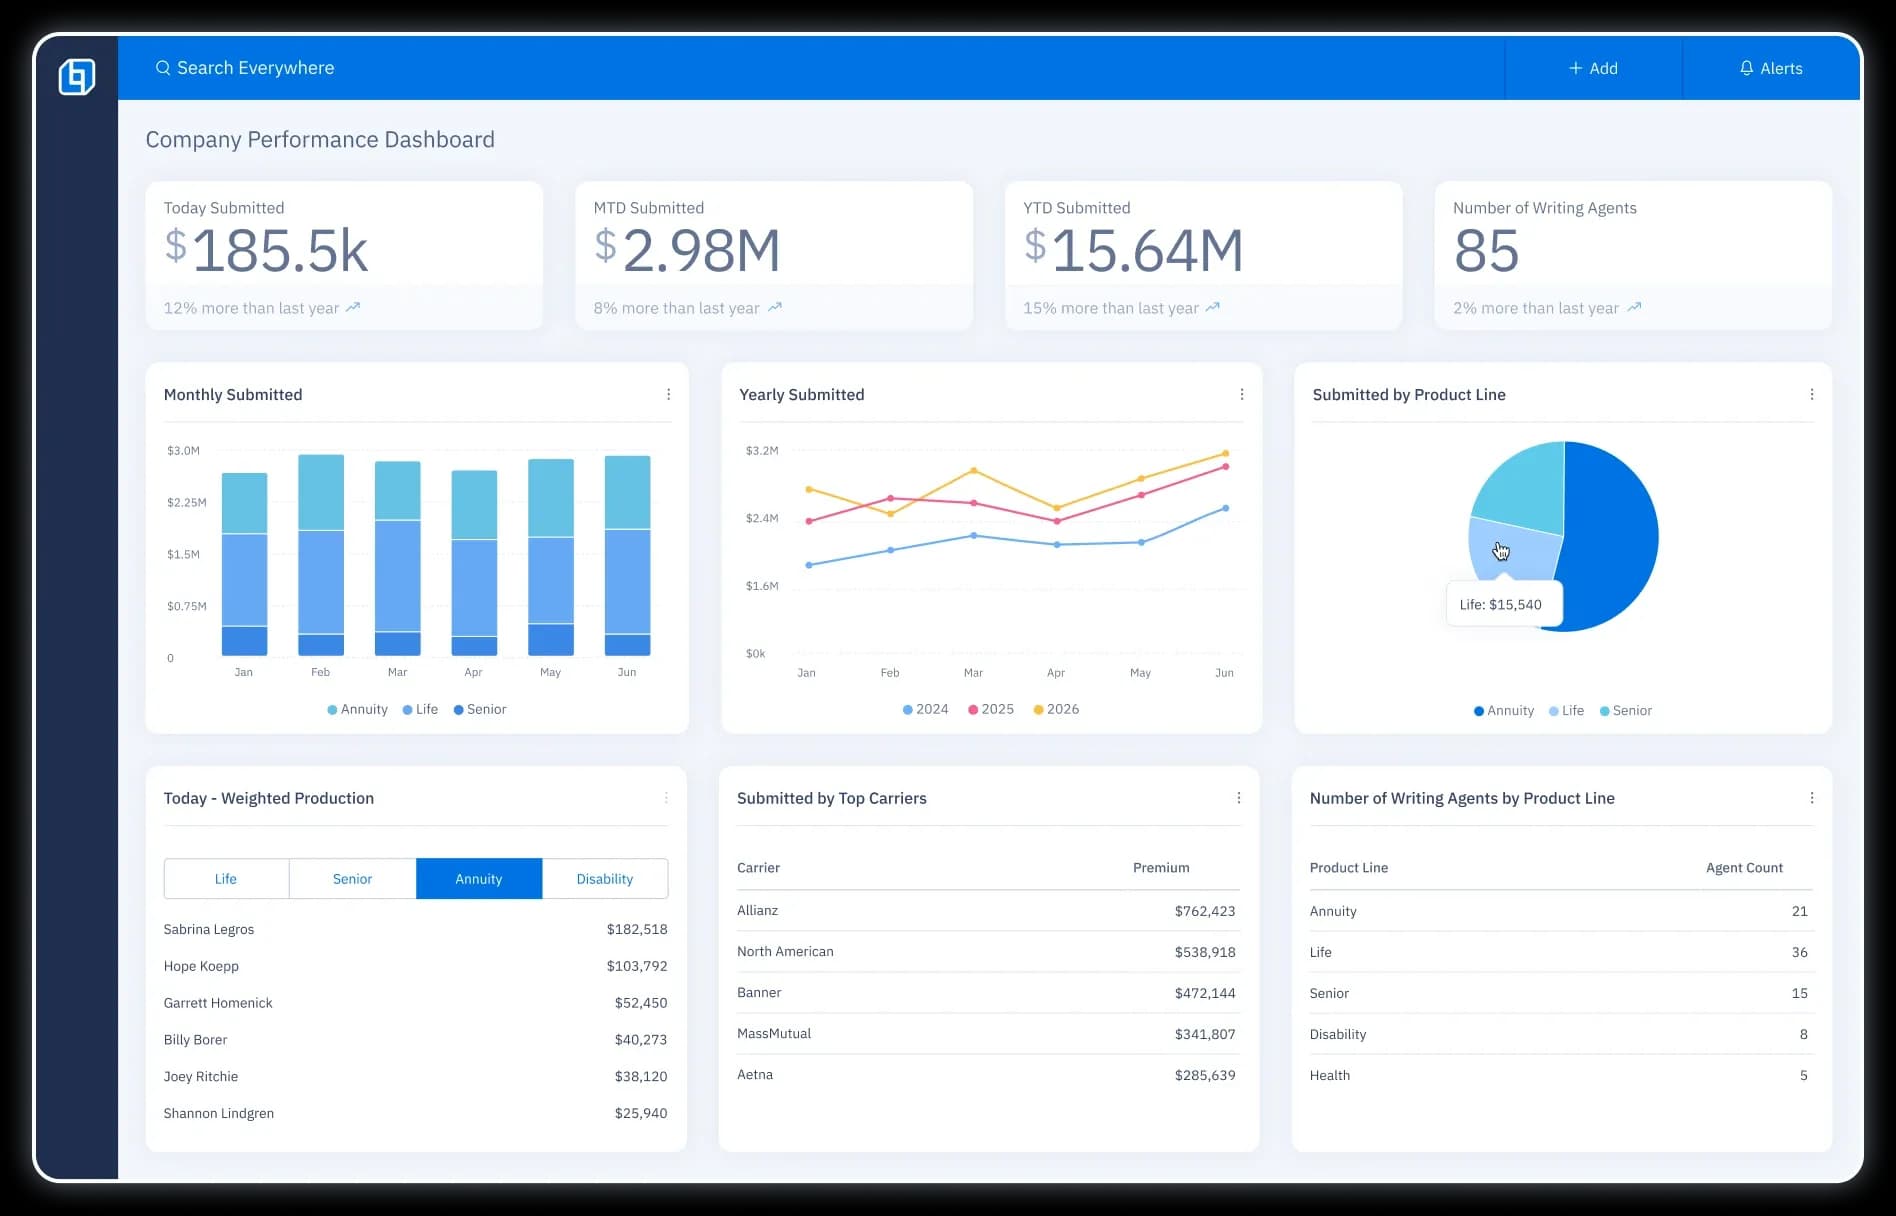
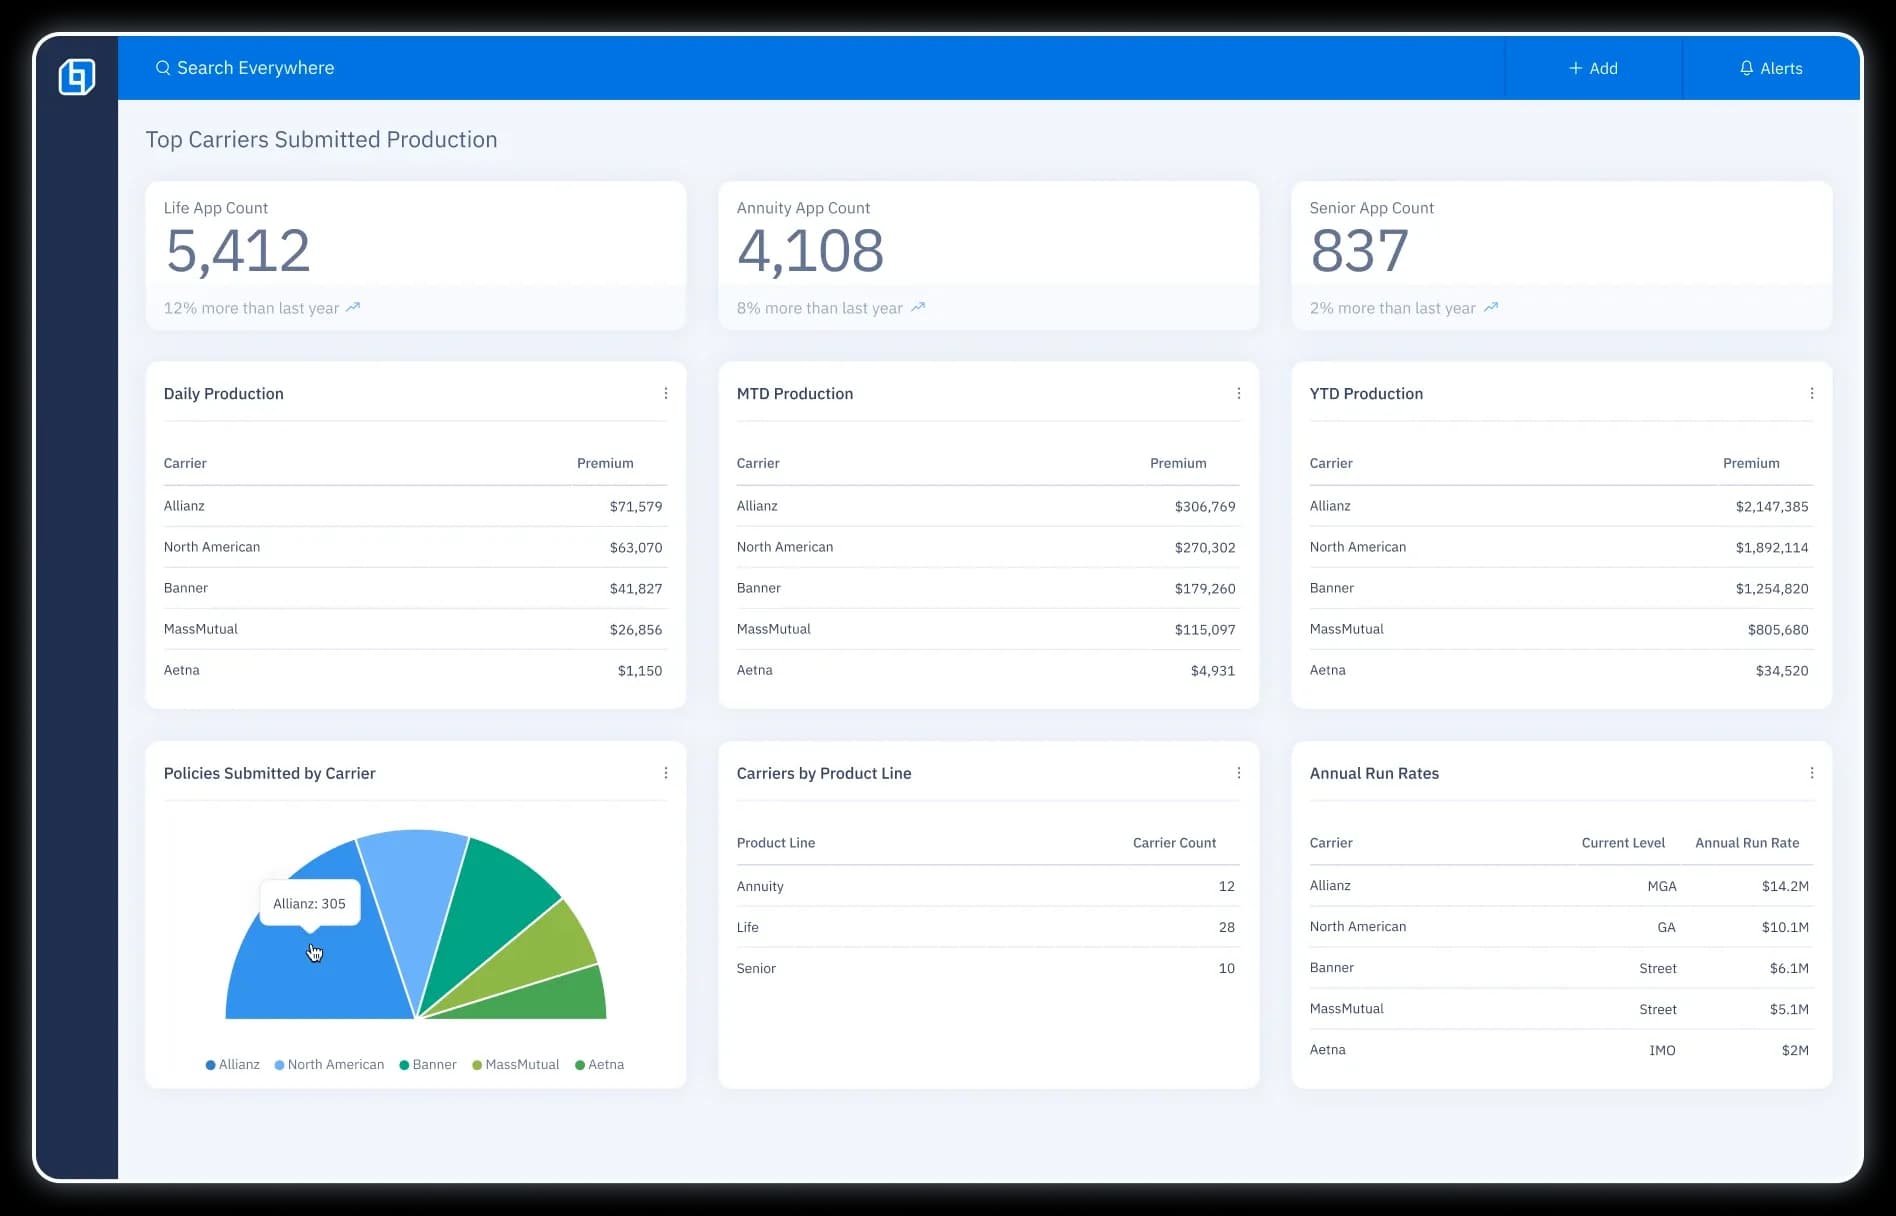
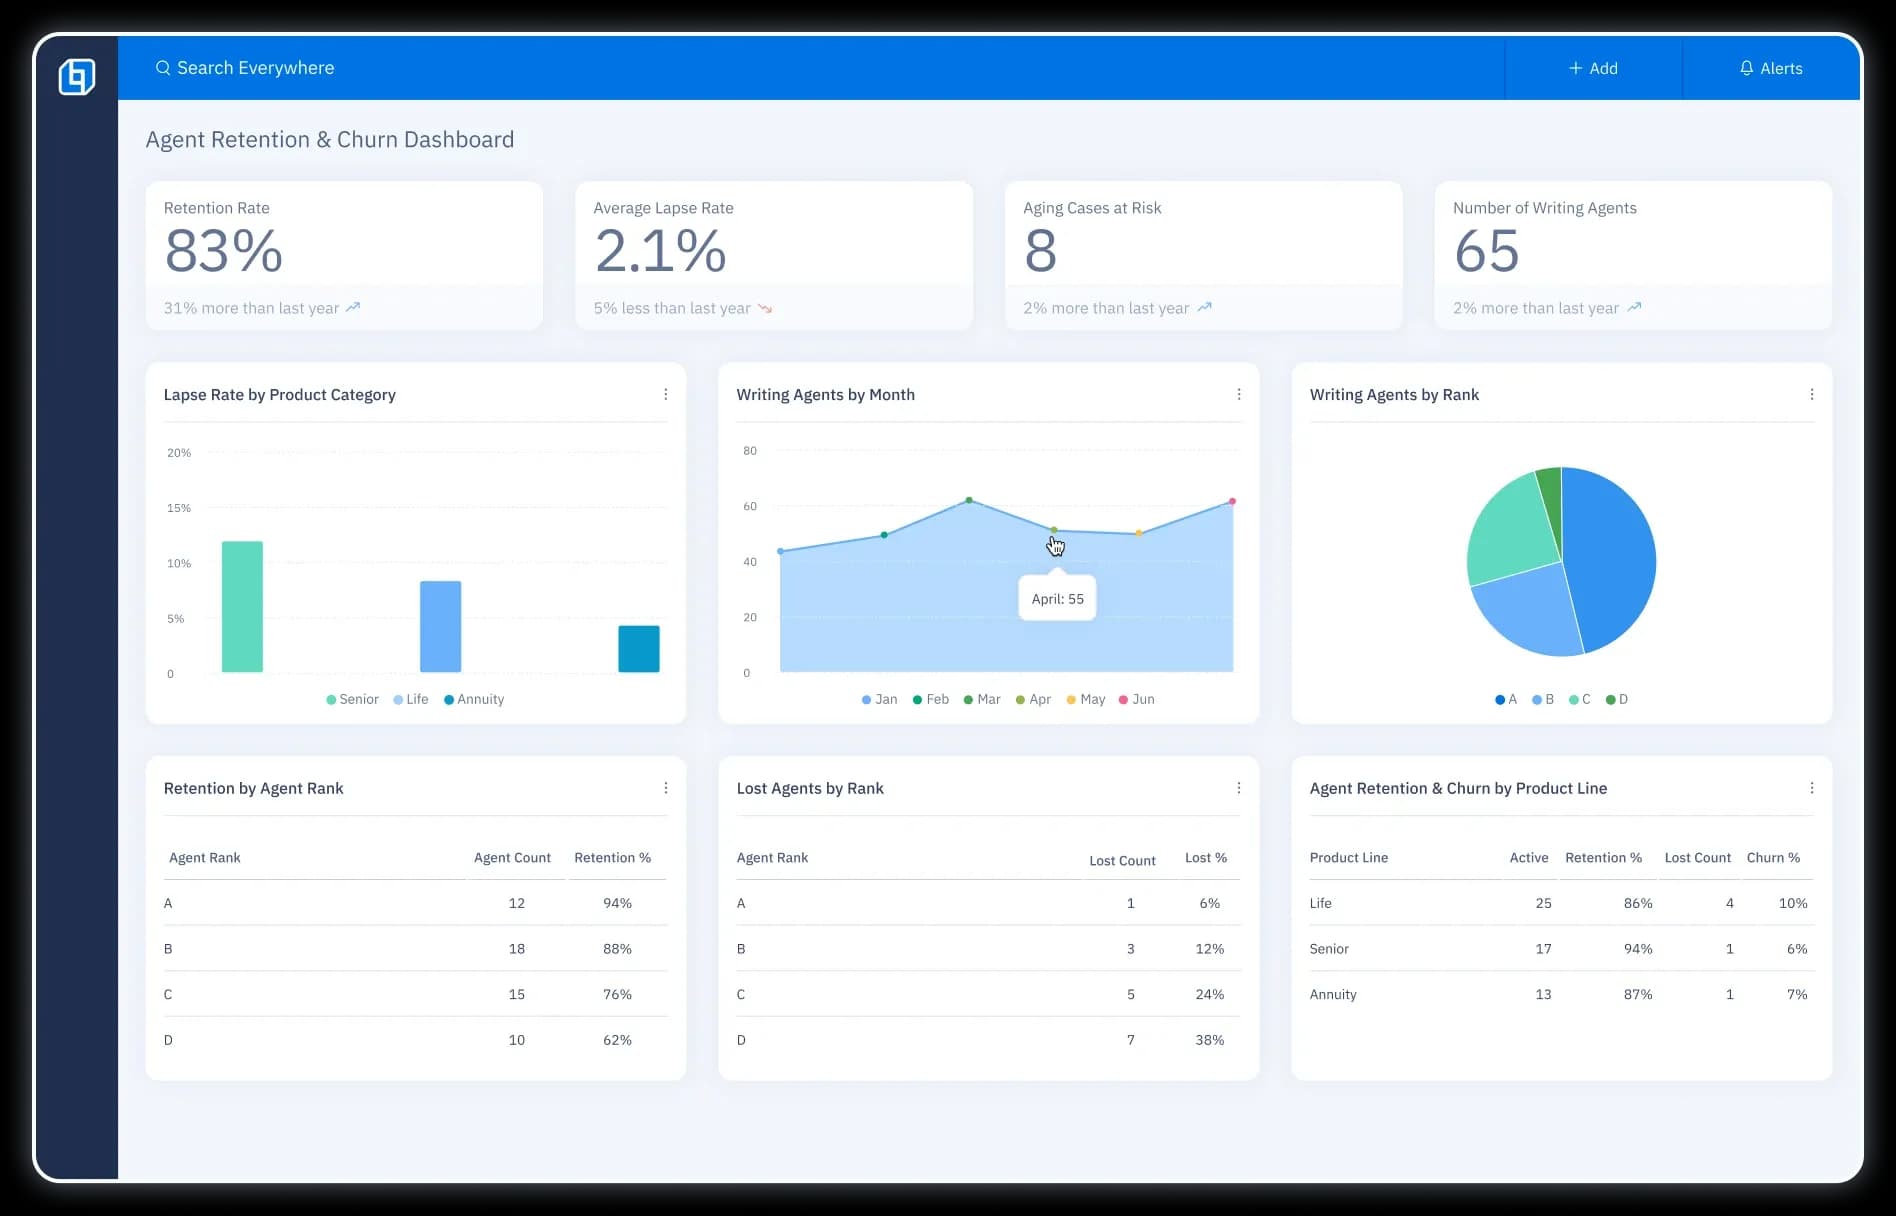
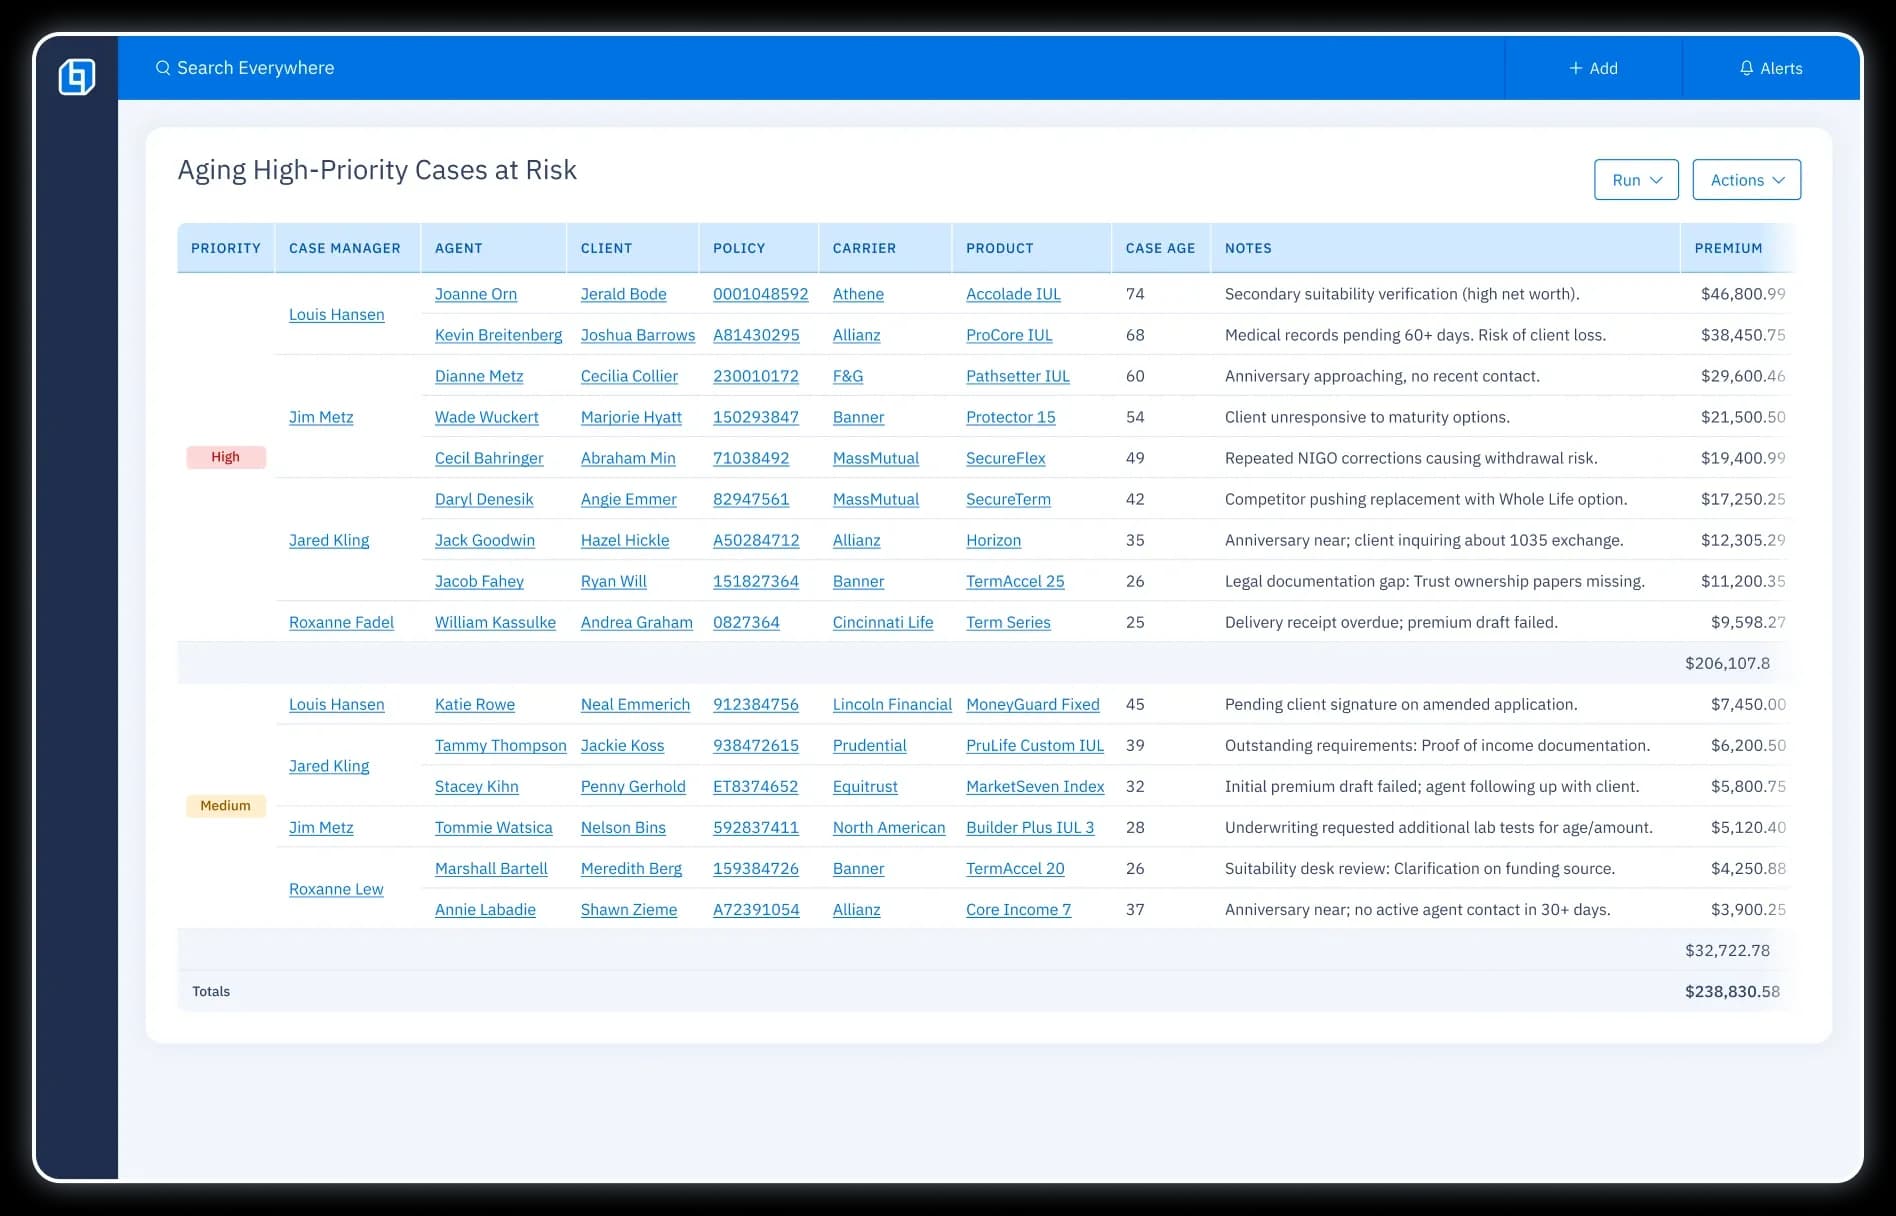
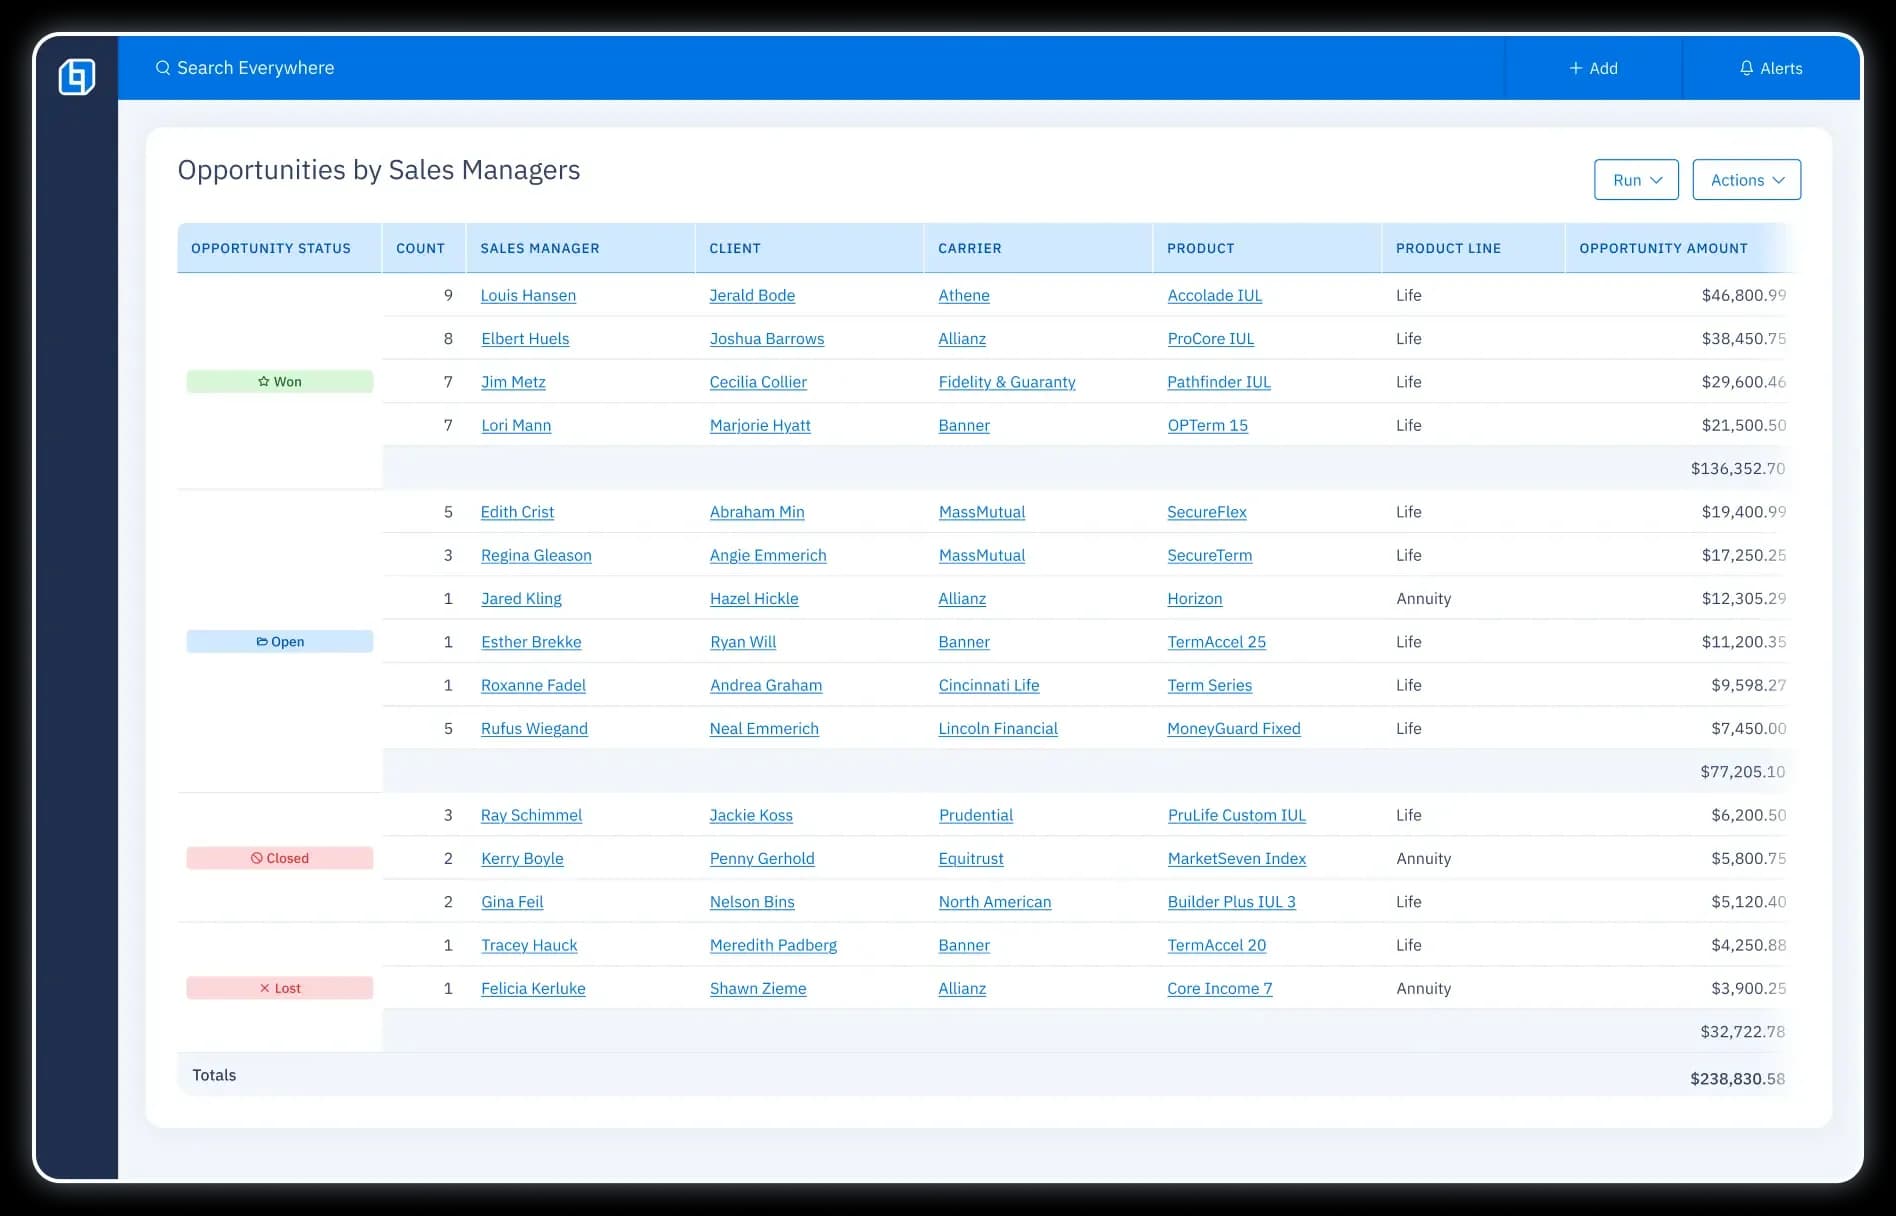
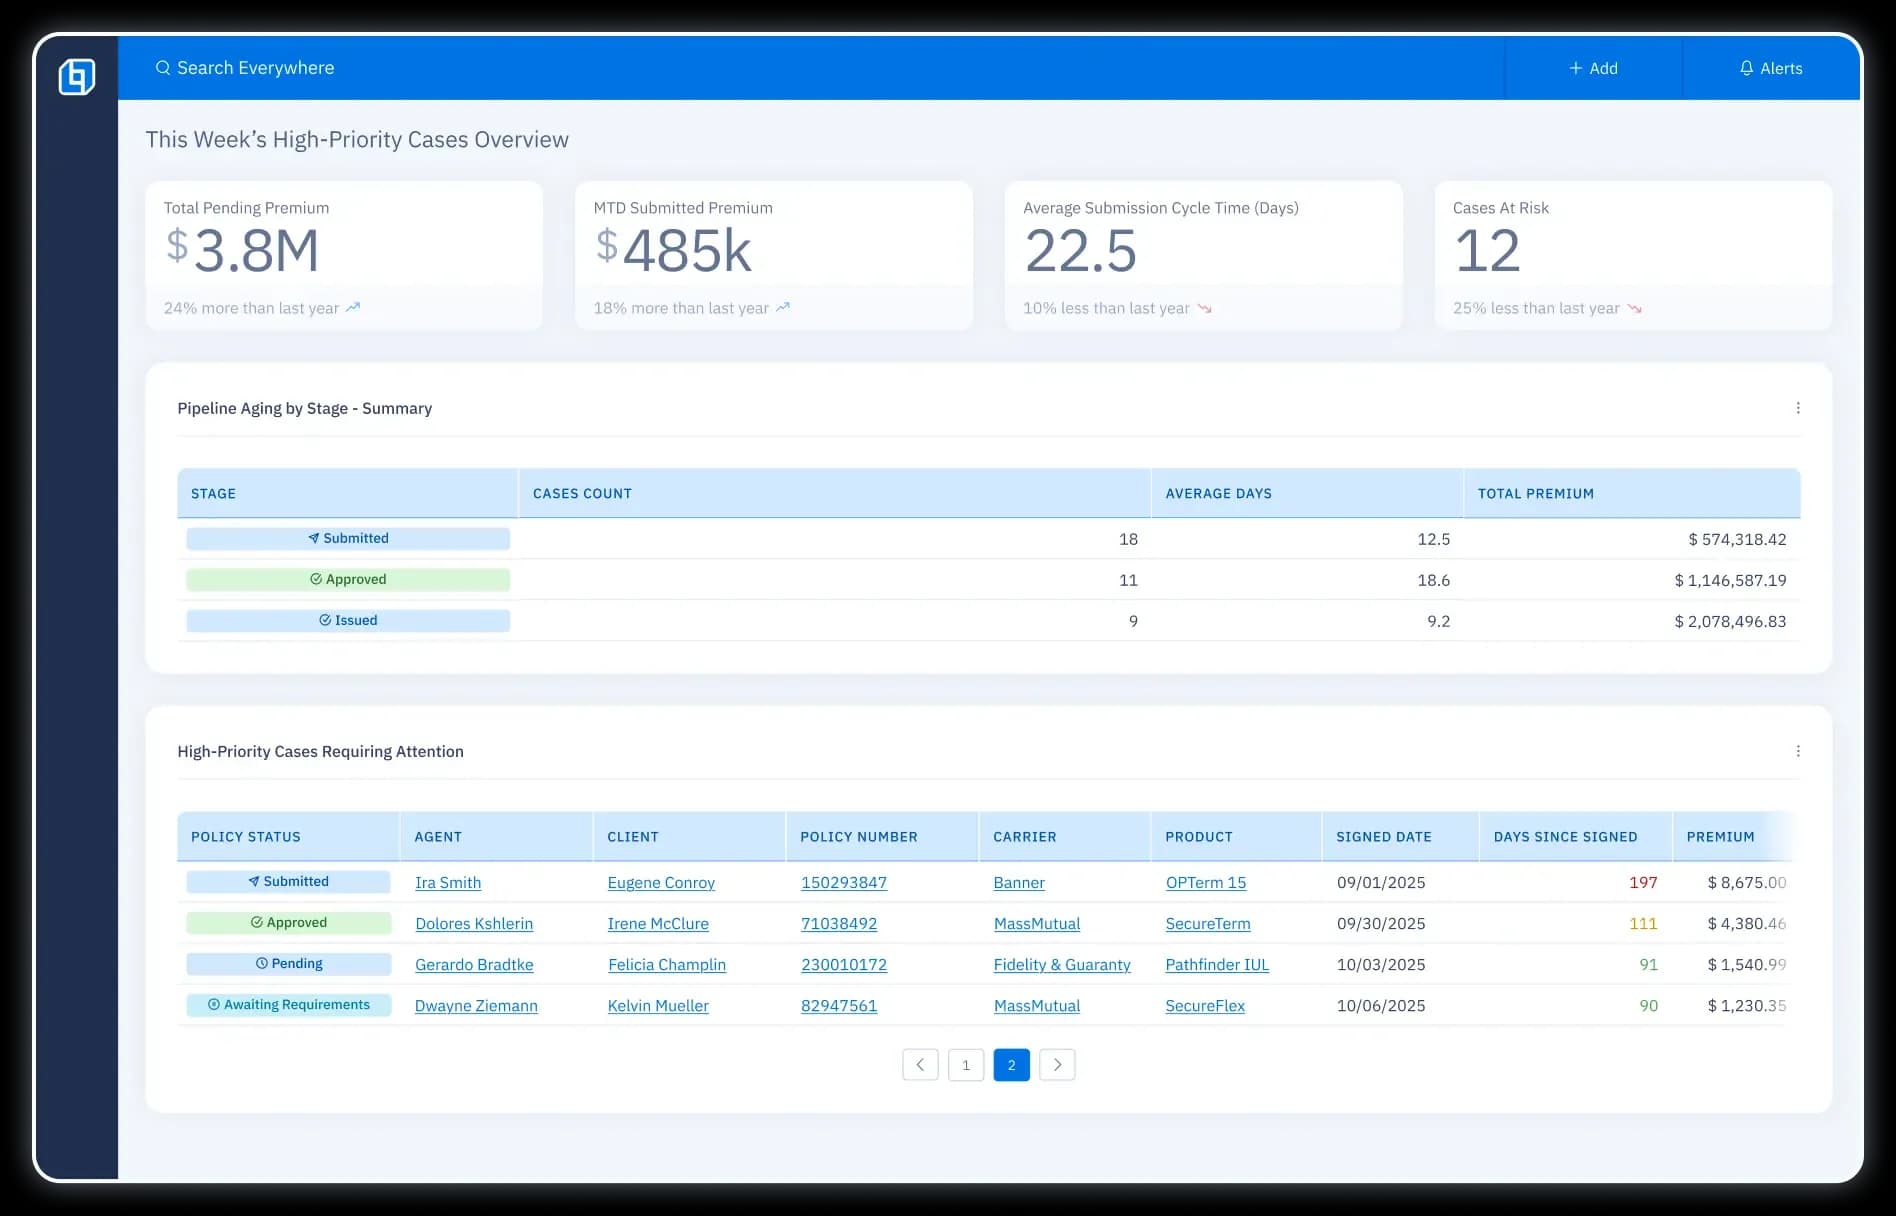
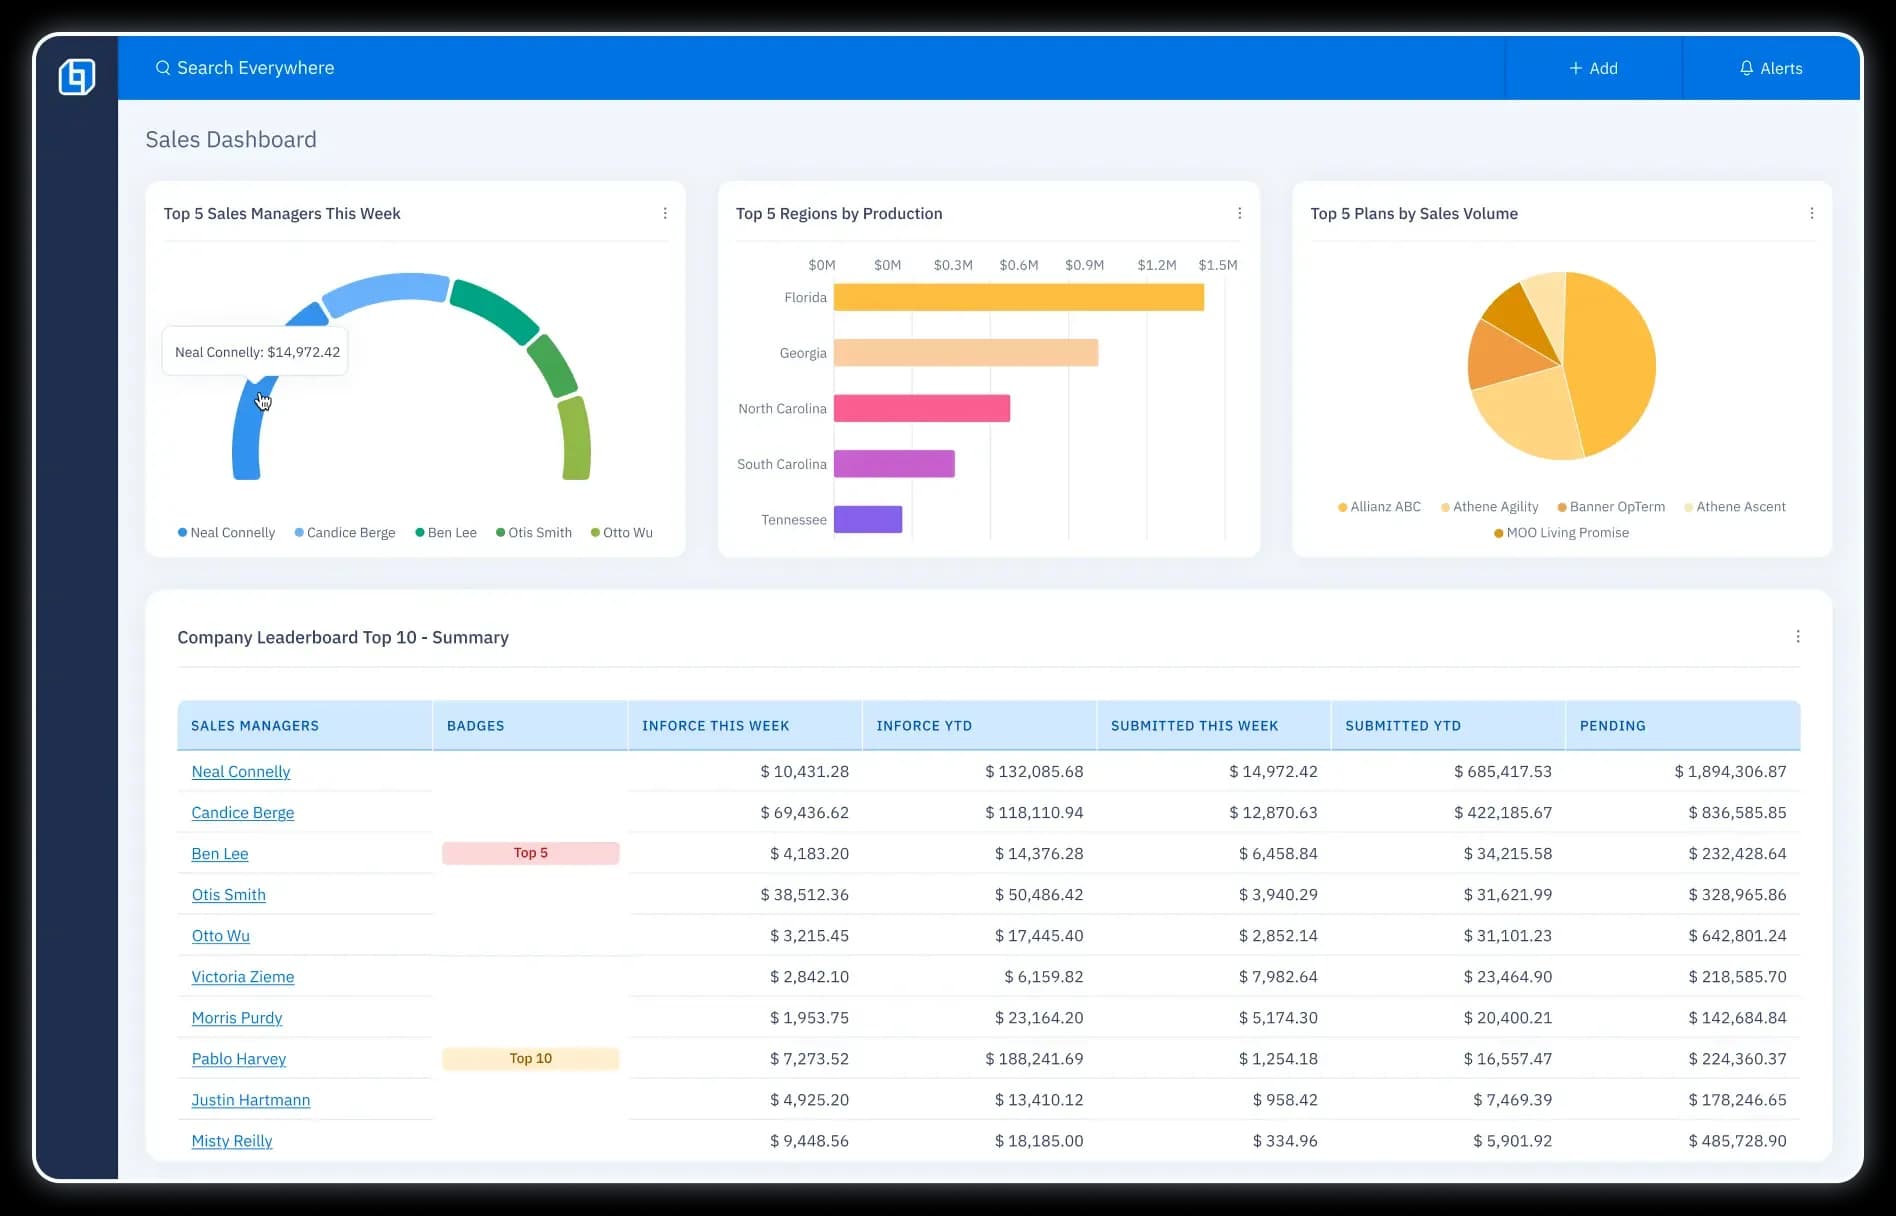
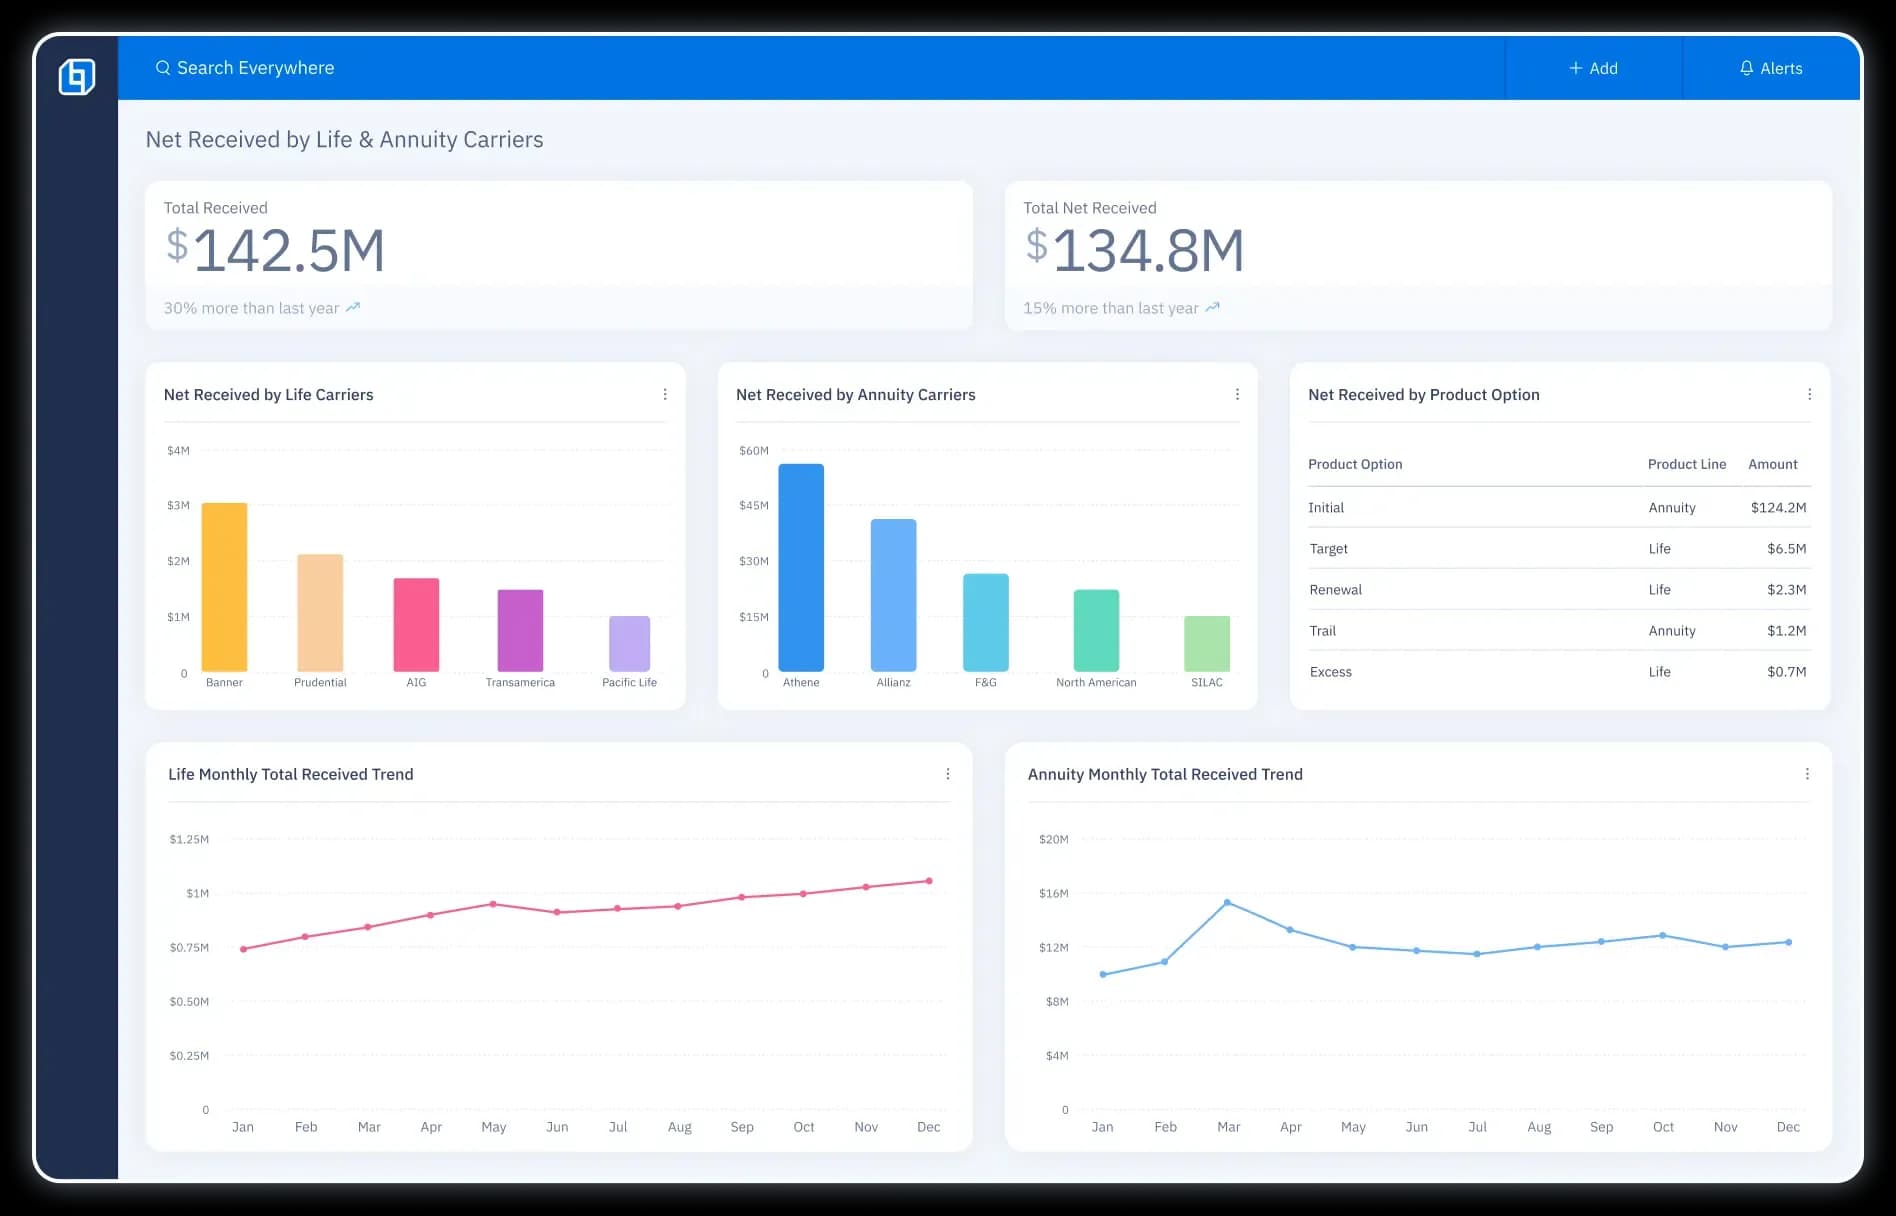
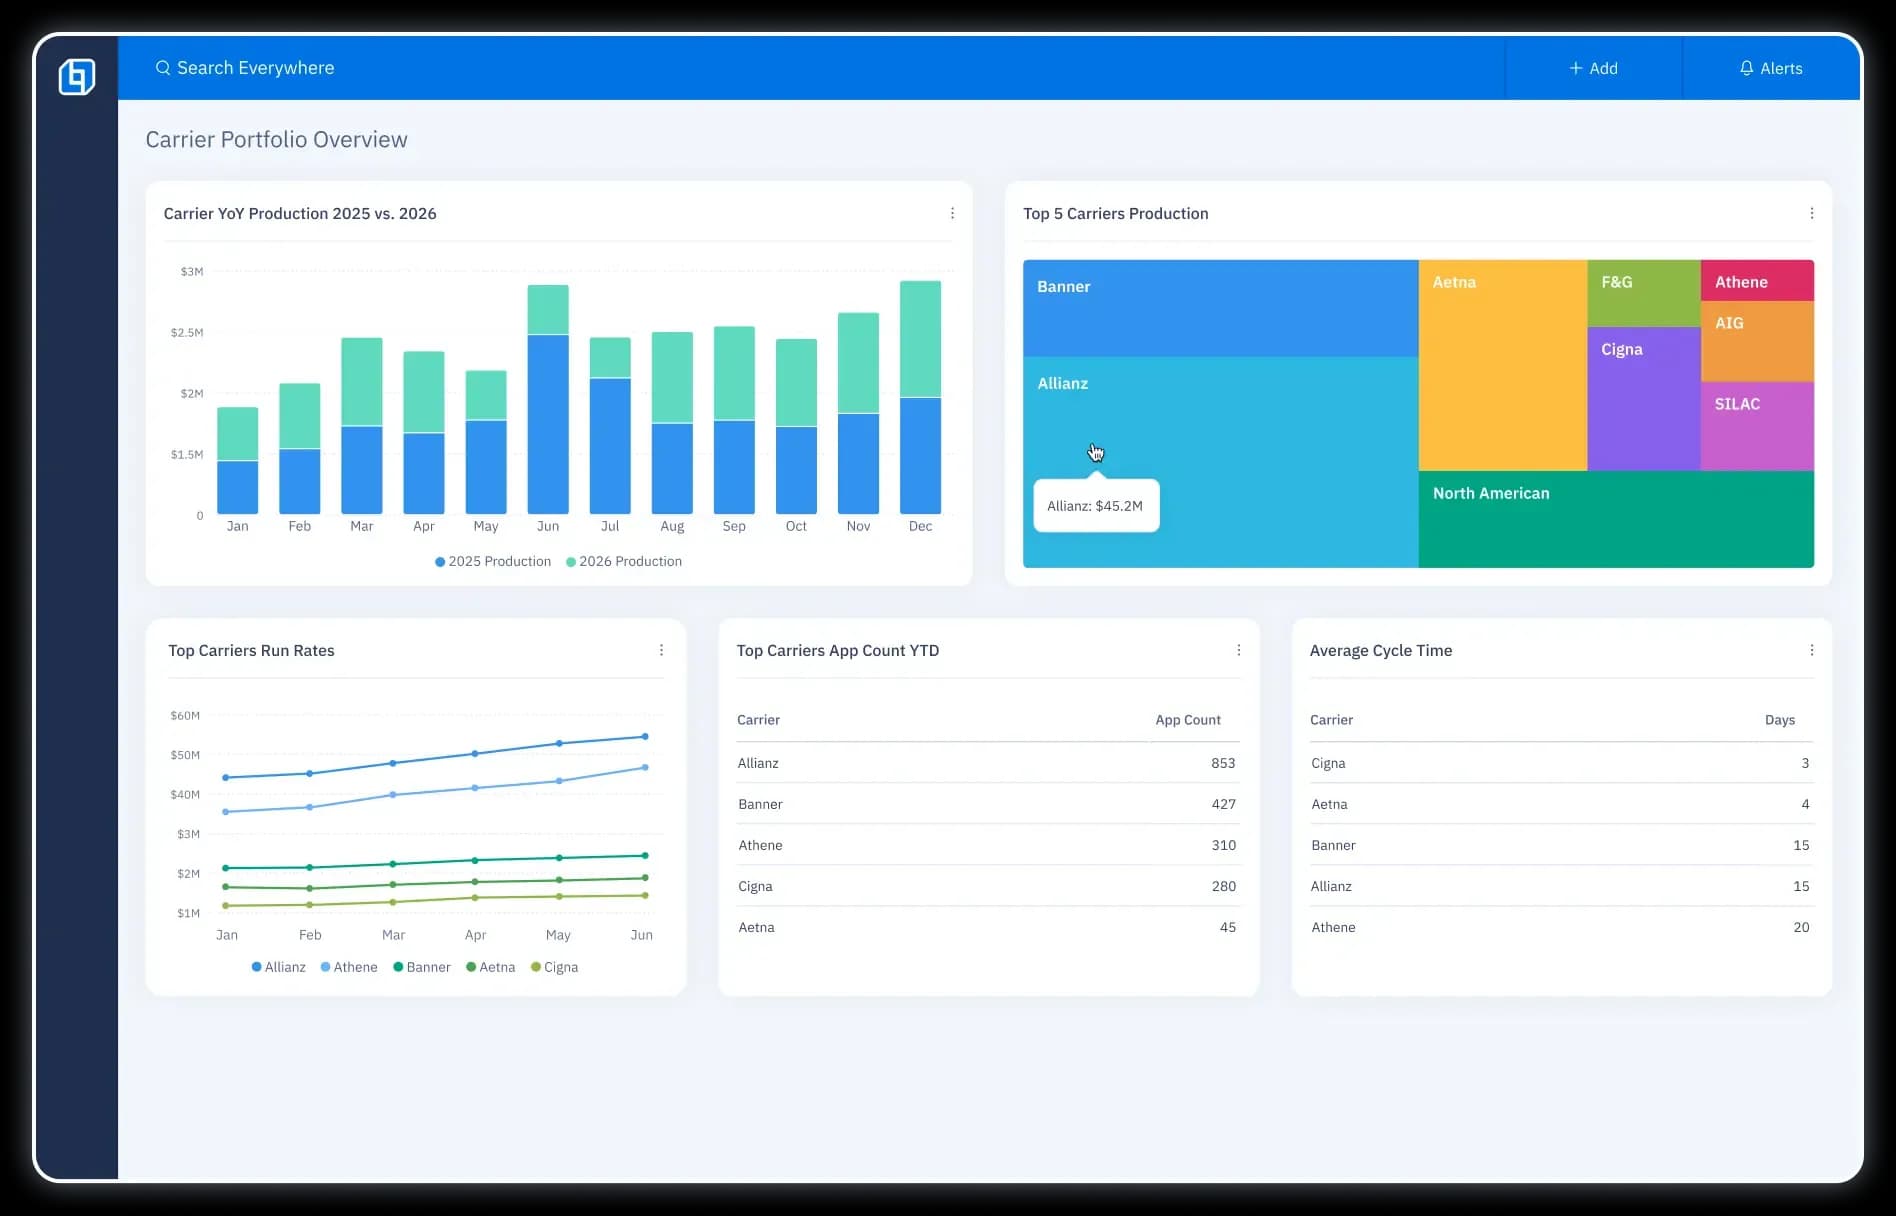
Data Visualization
Data that works for you.
Slowed down by...
Uninformed decisions?
Missed opportunities?
Manual reporting?
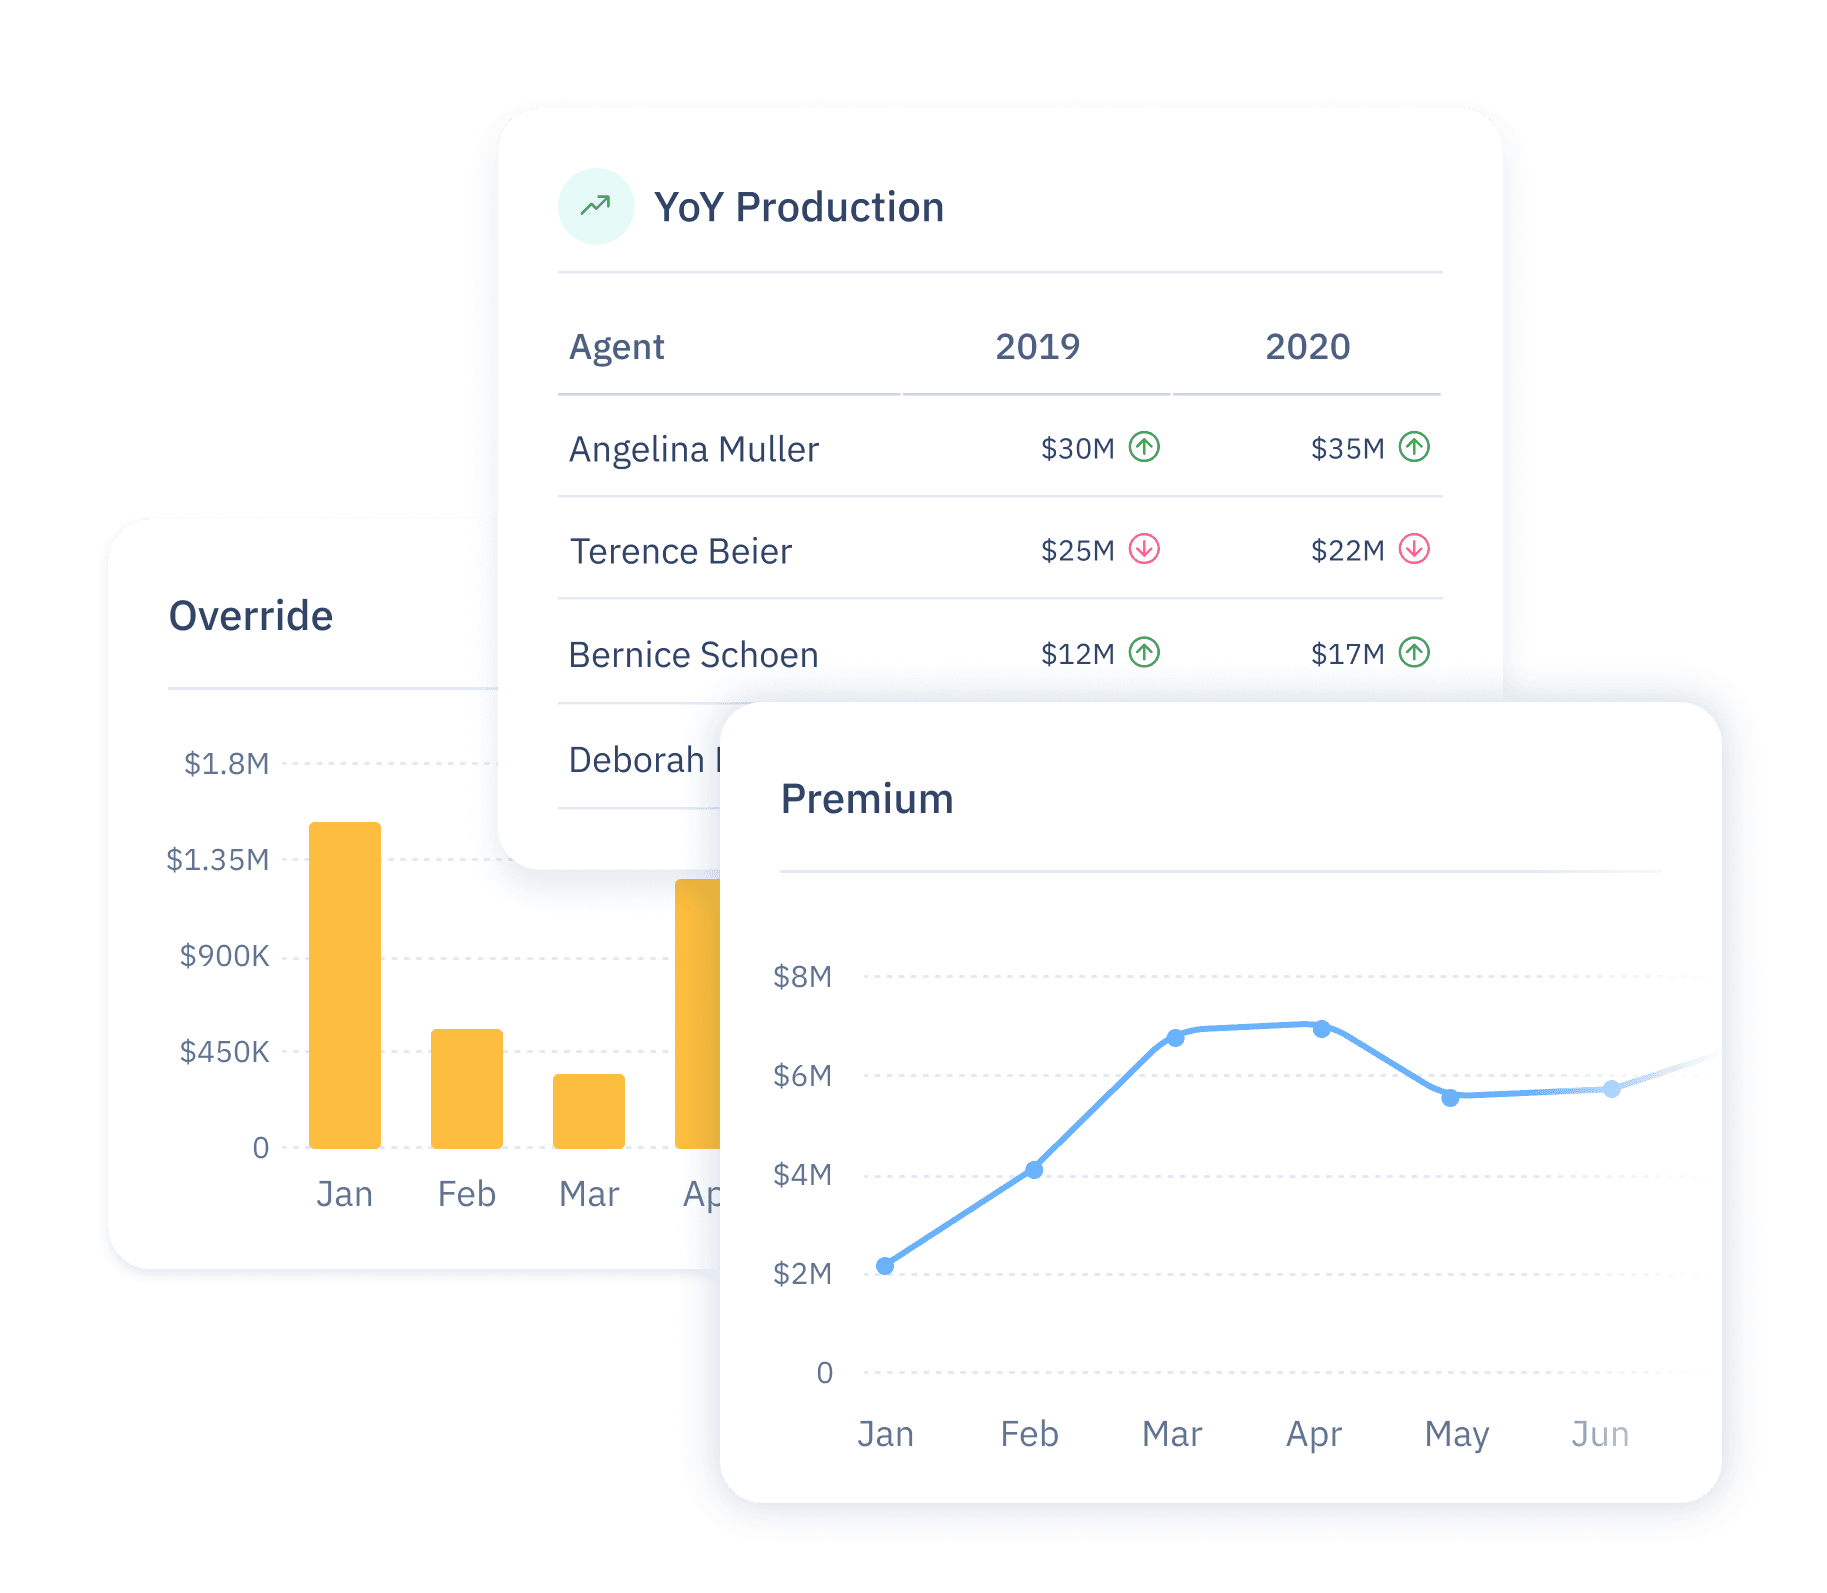
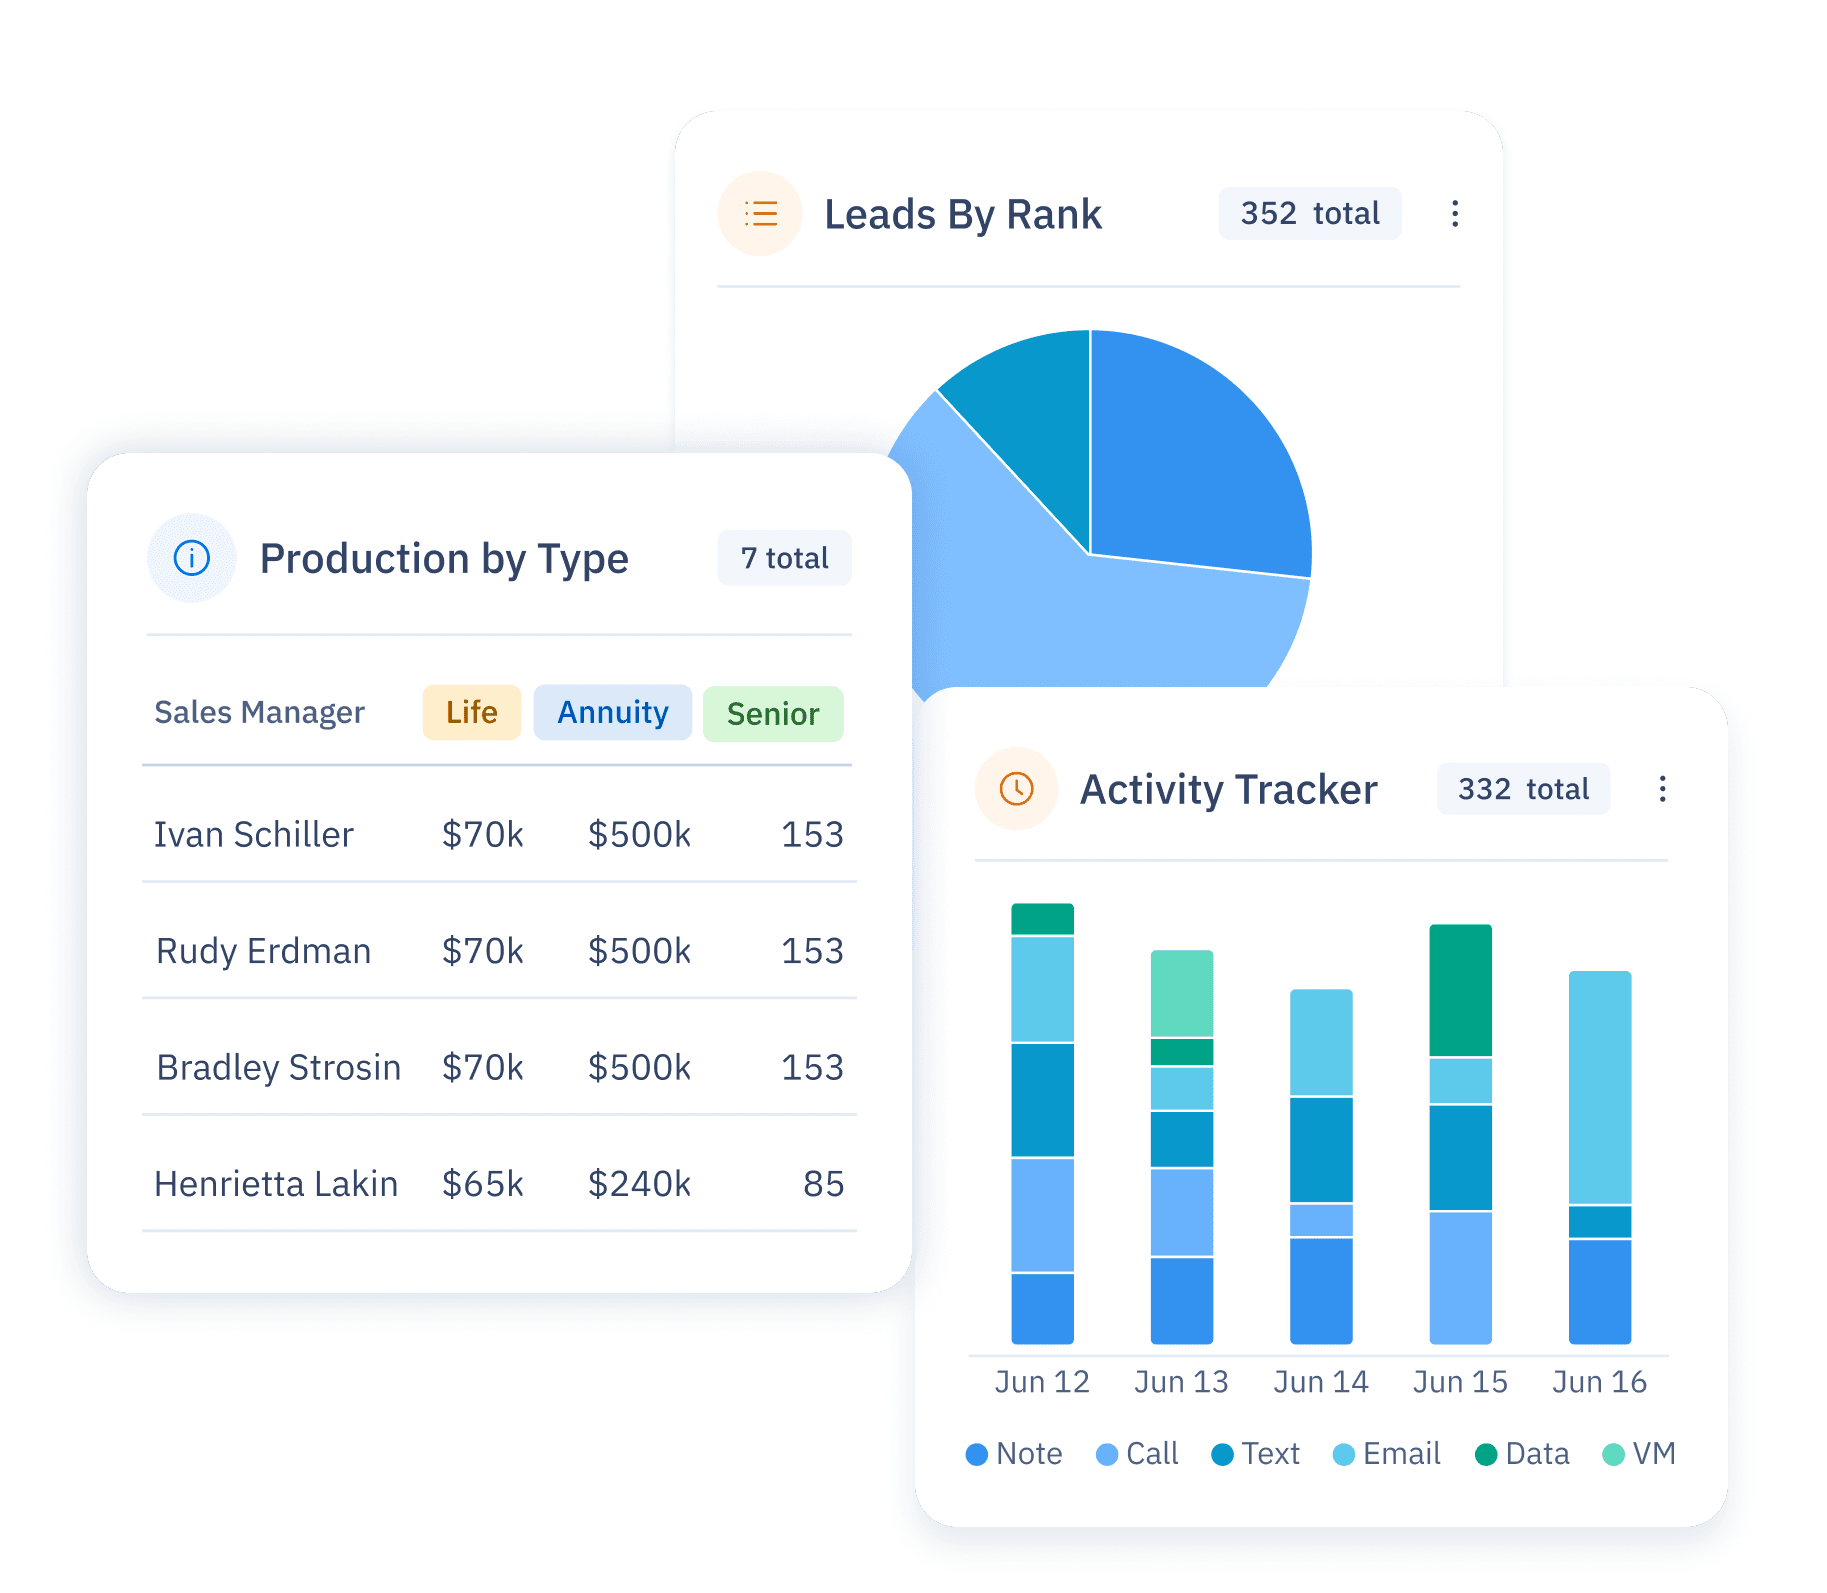
Create a data-driven culture.
Give every team the data they need to perform at their best.
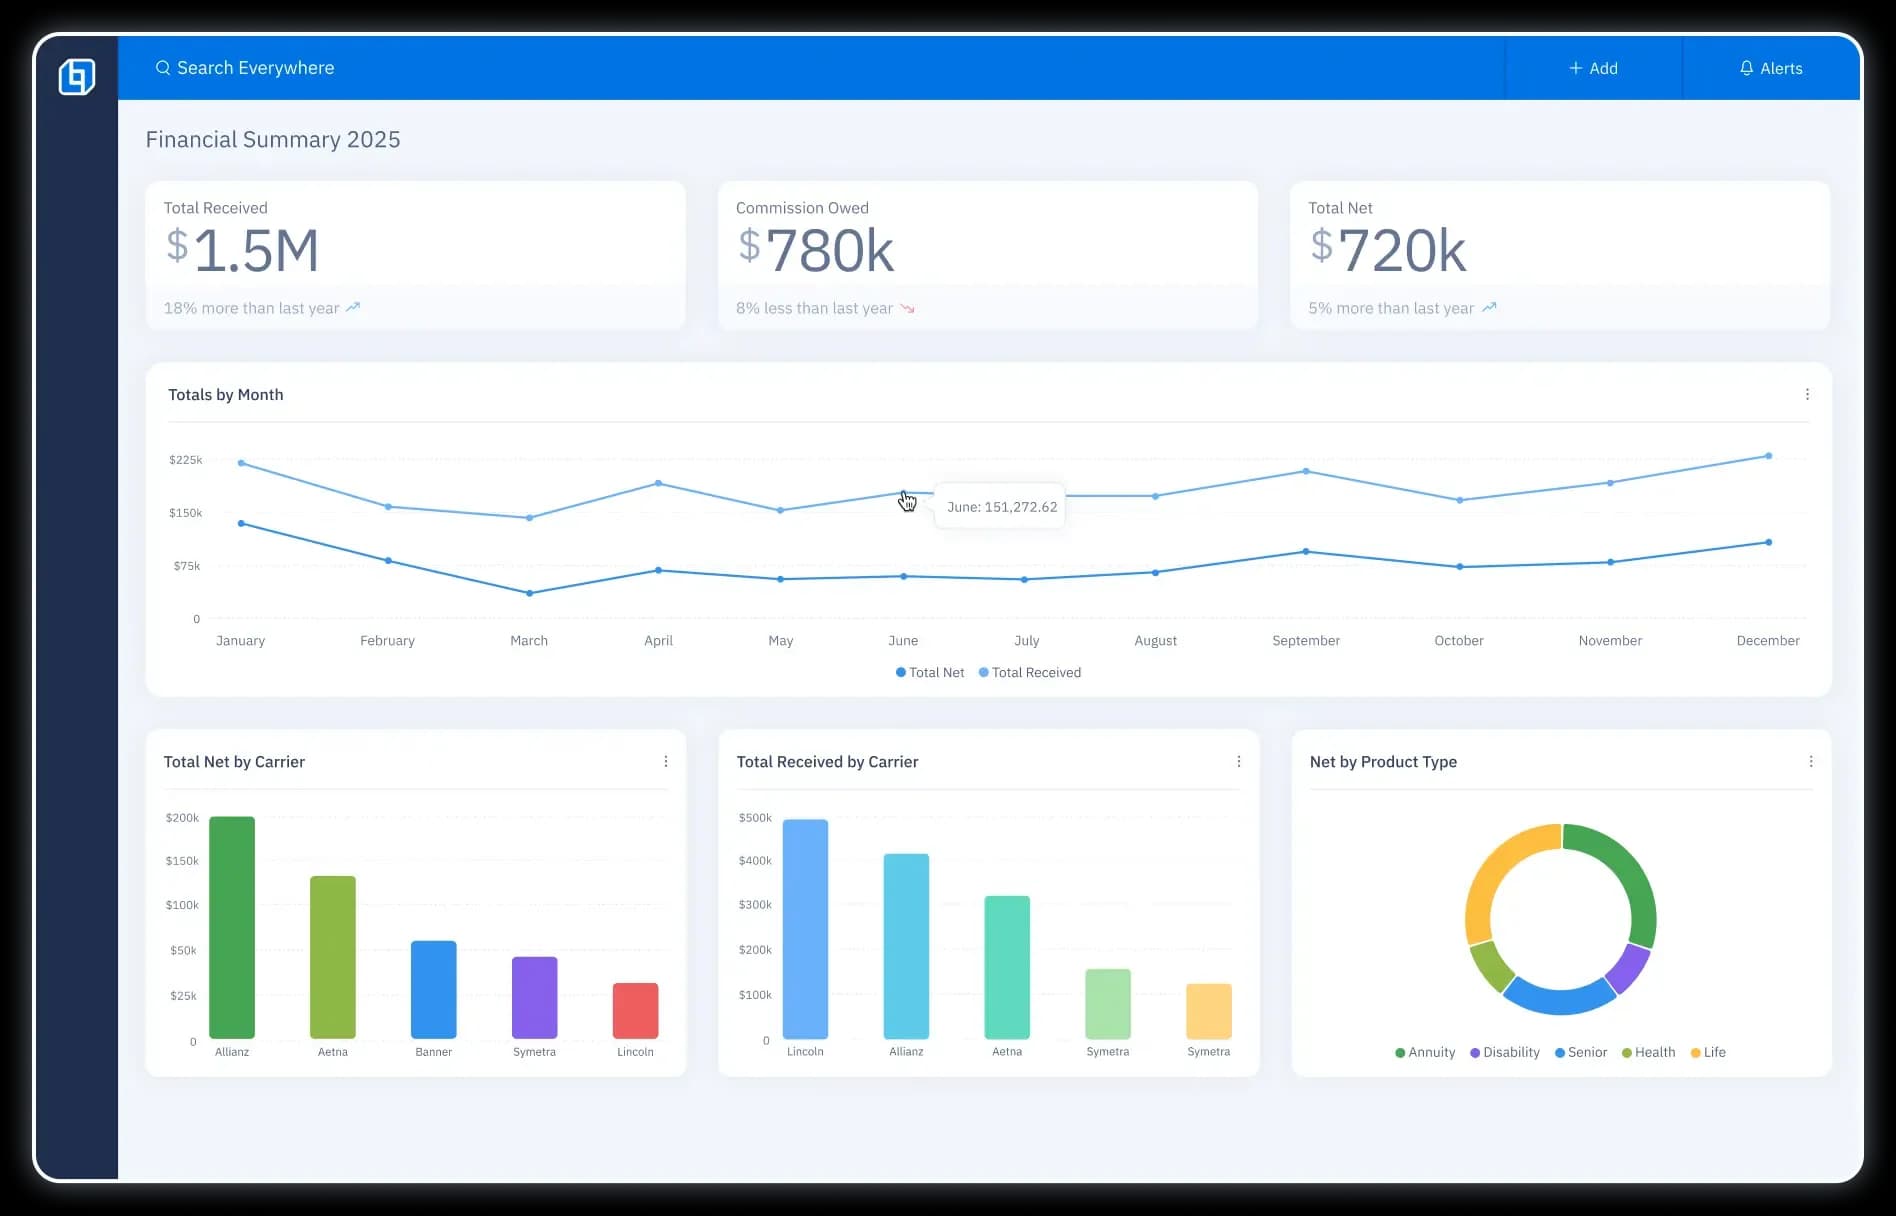
Executives
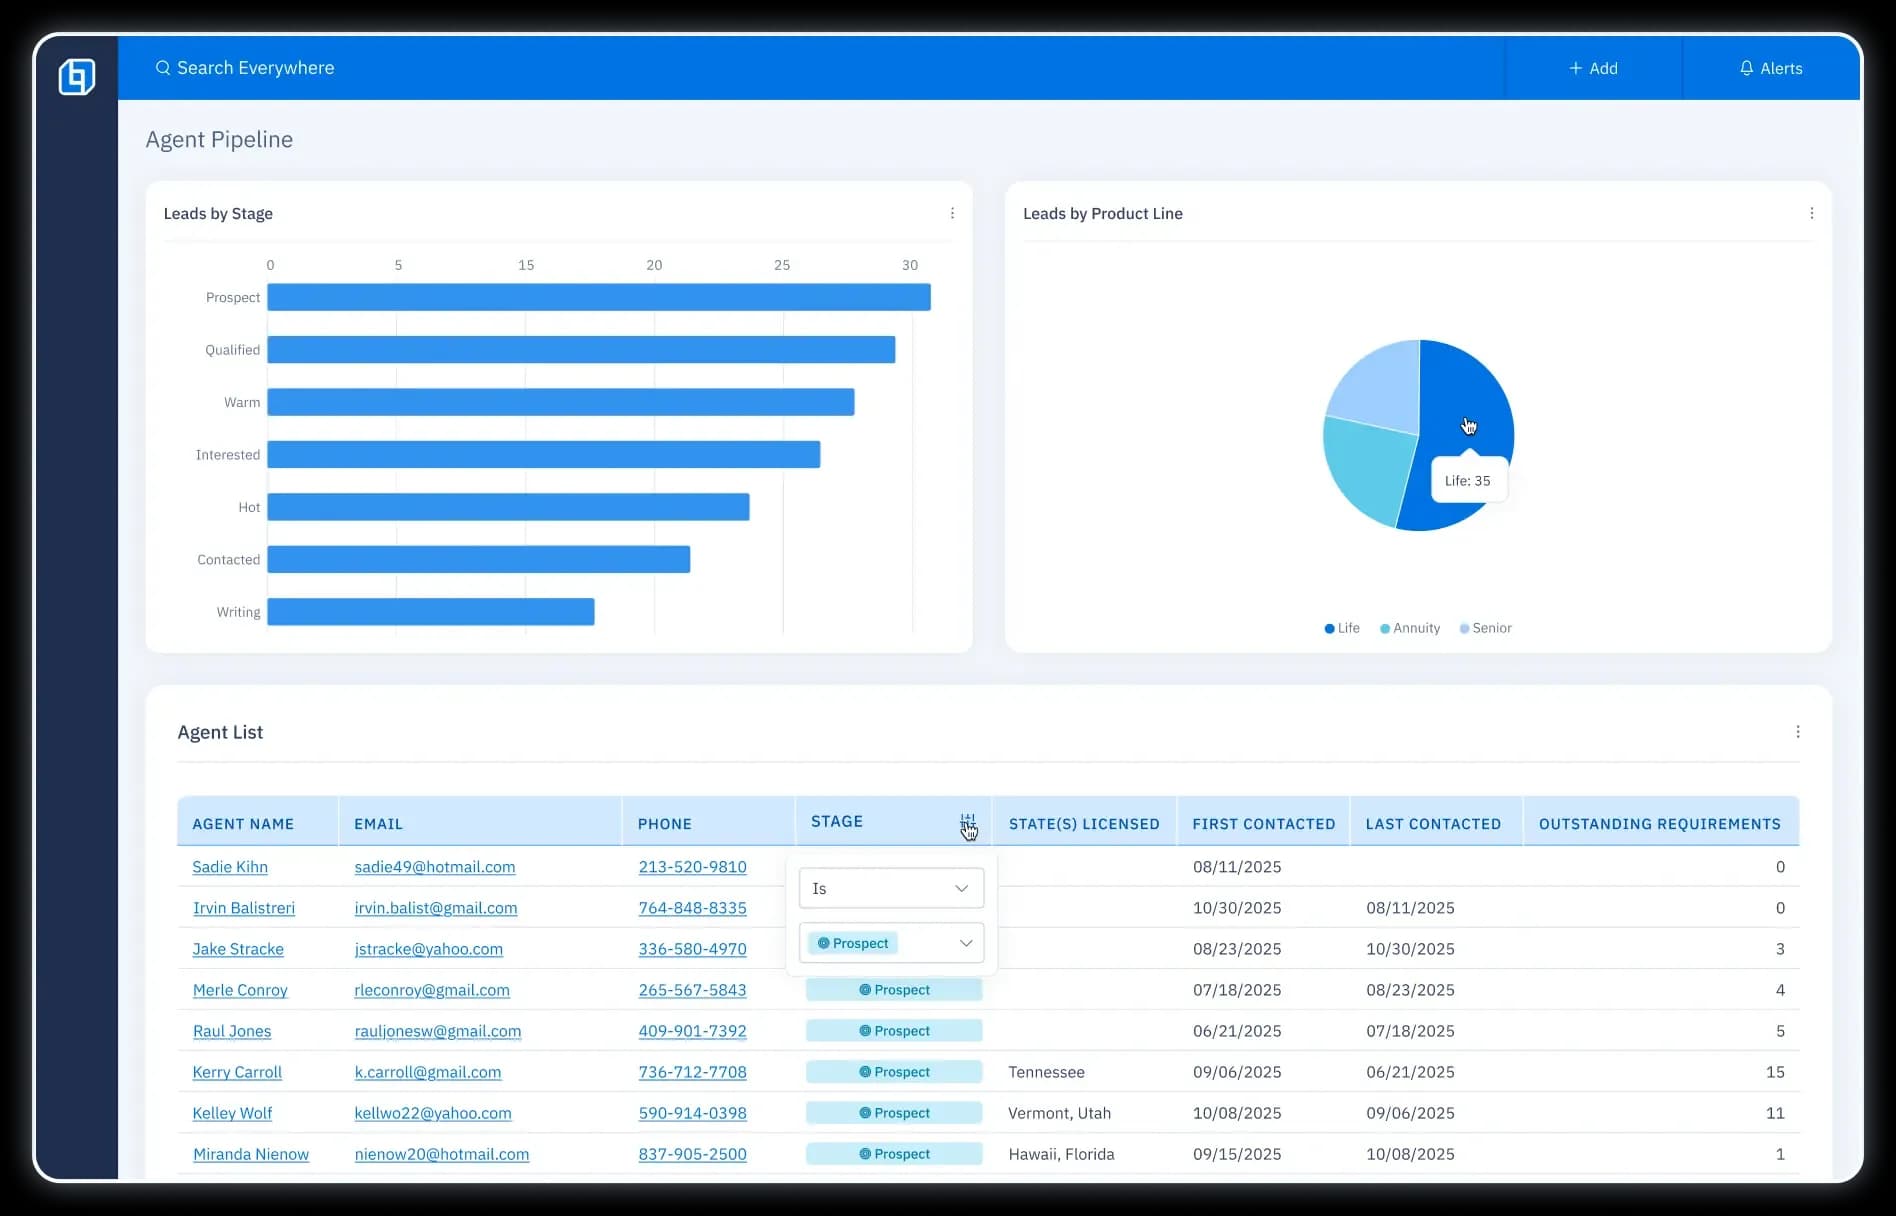
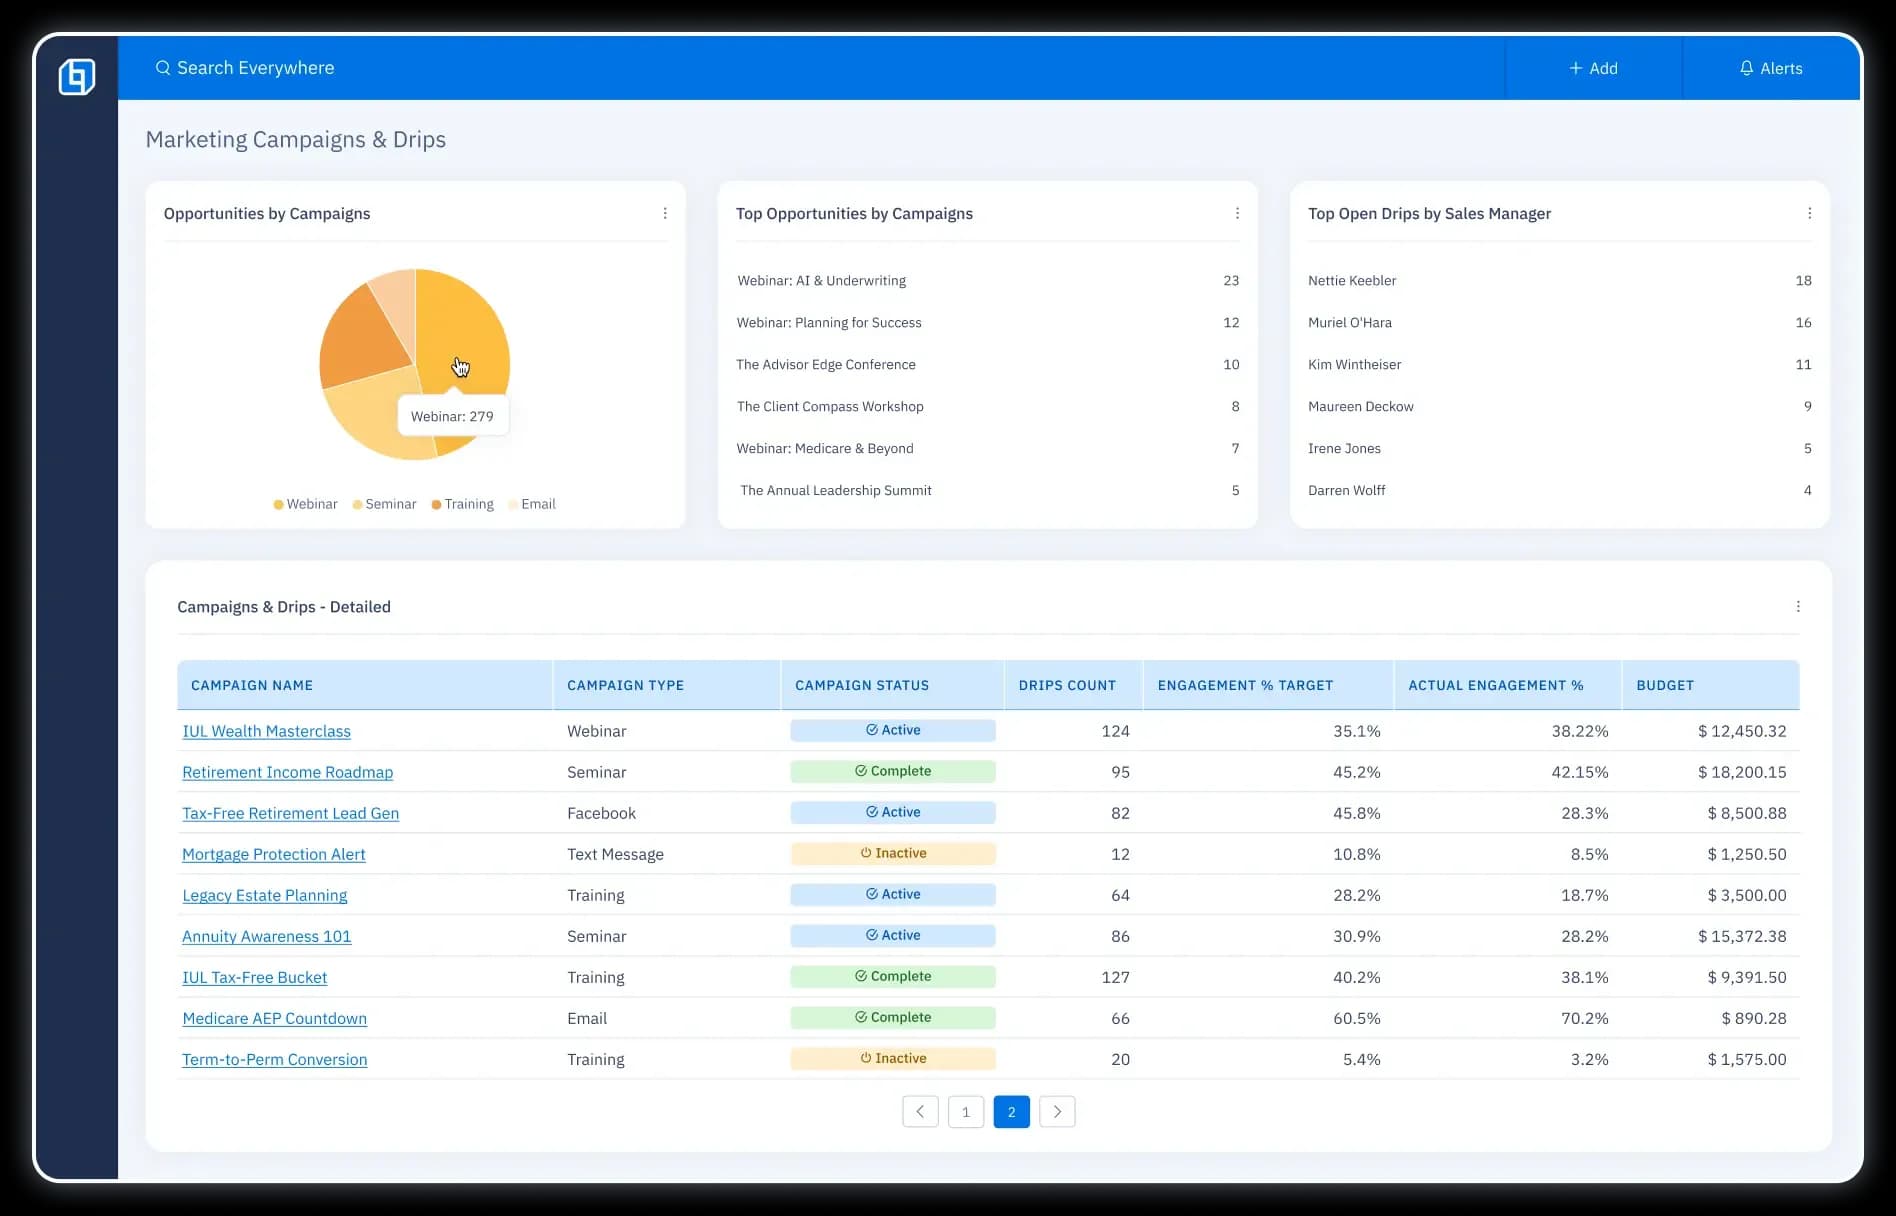
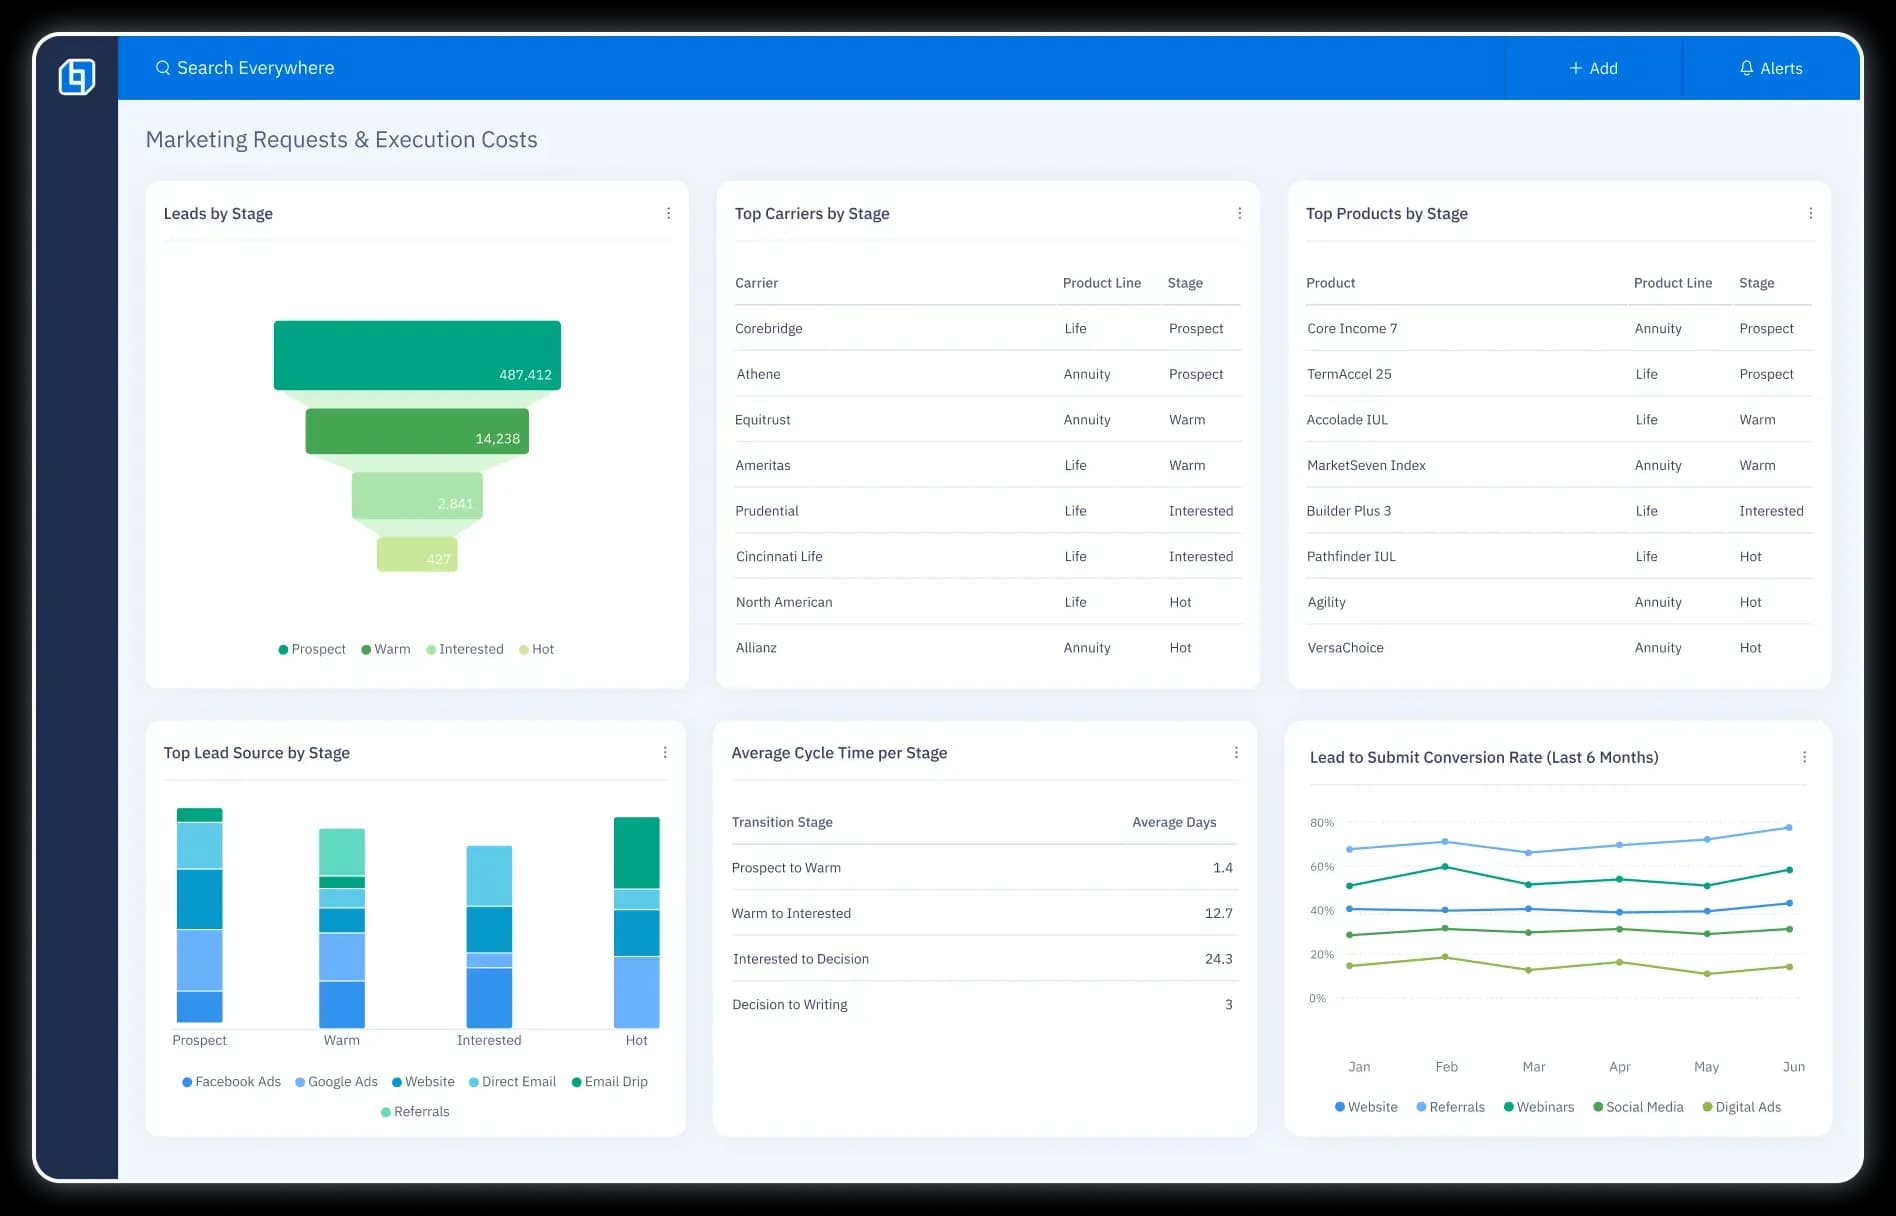
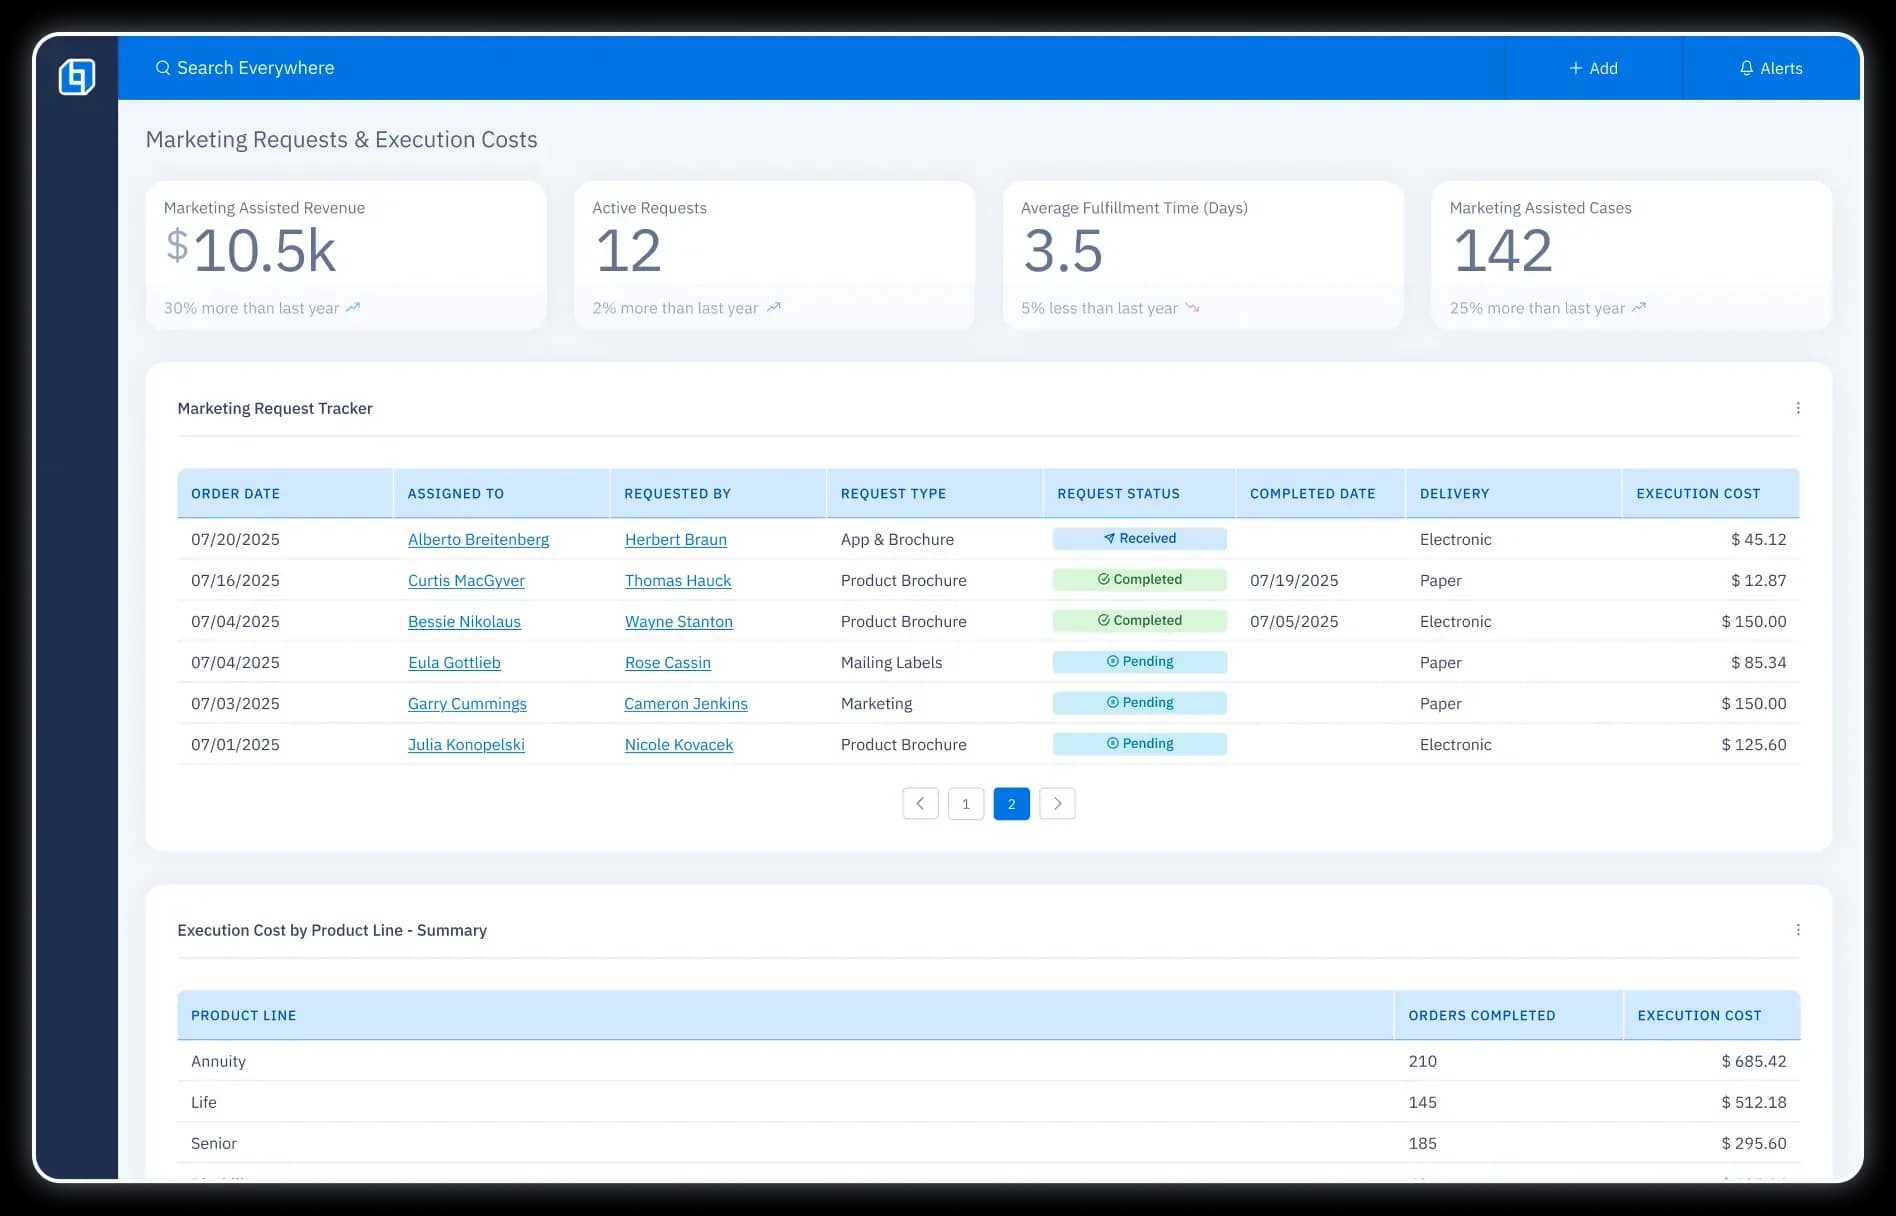
Sales & Marketing
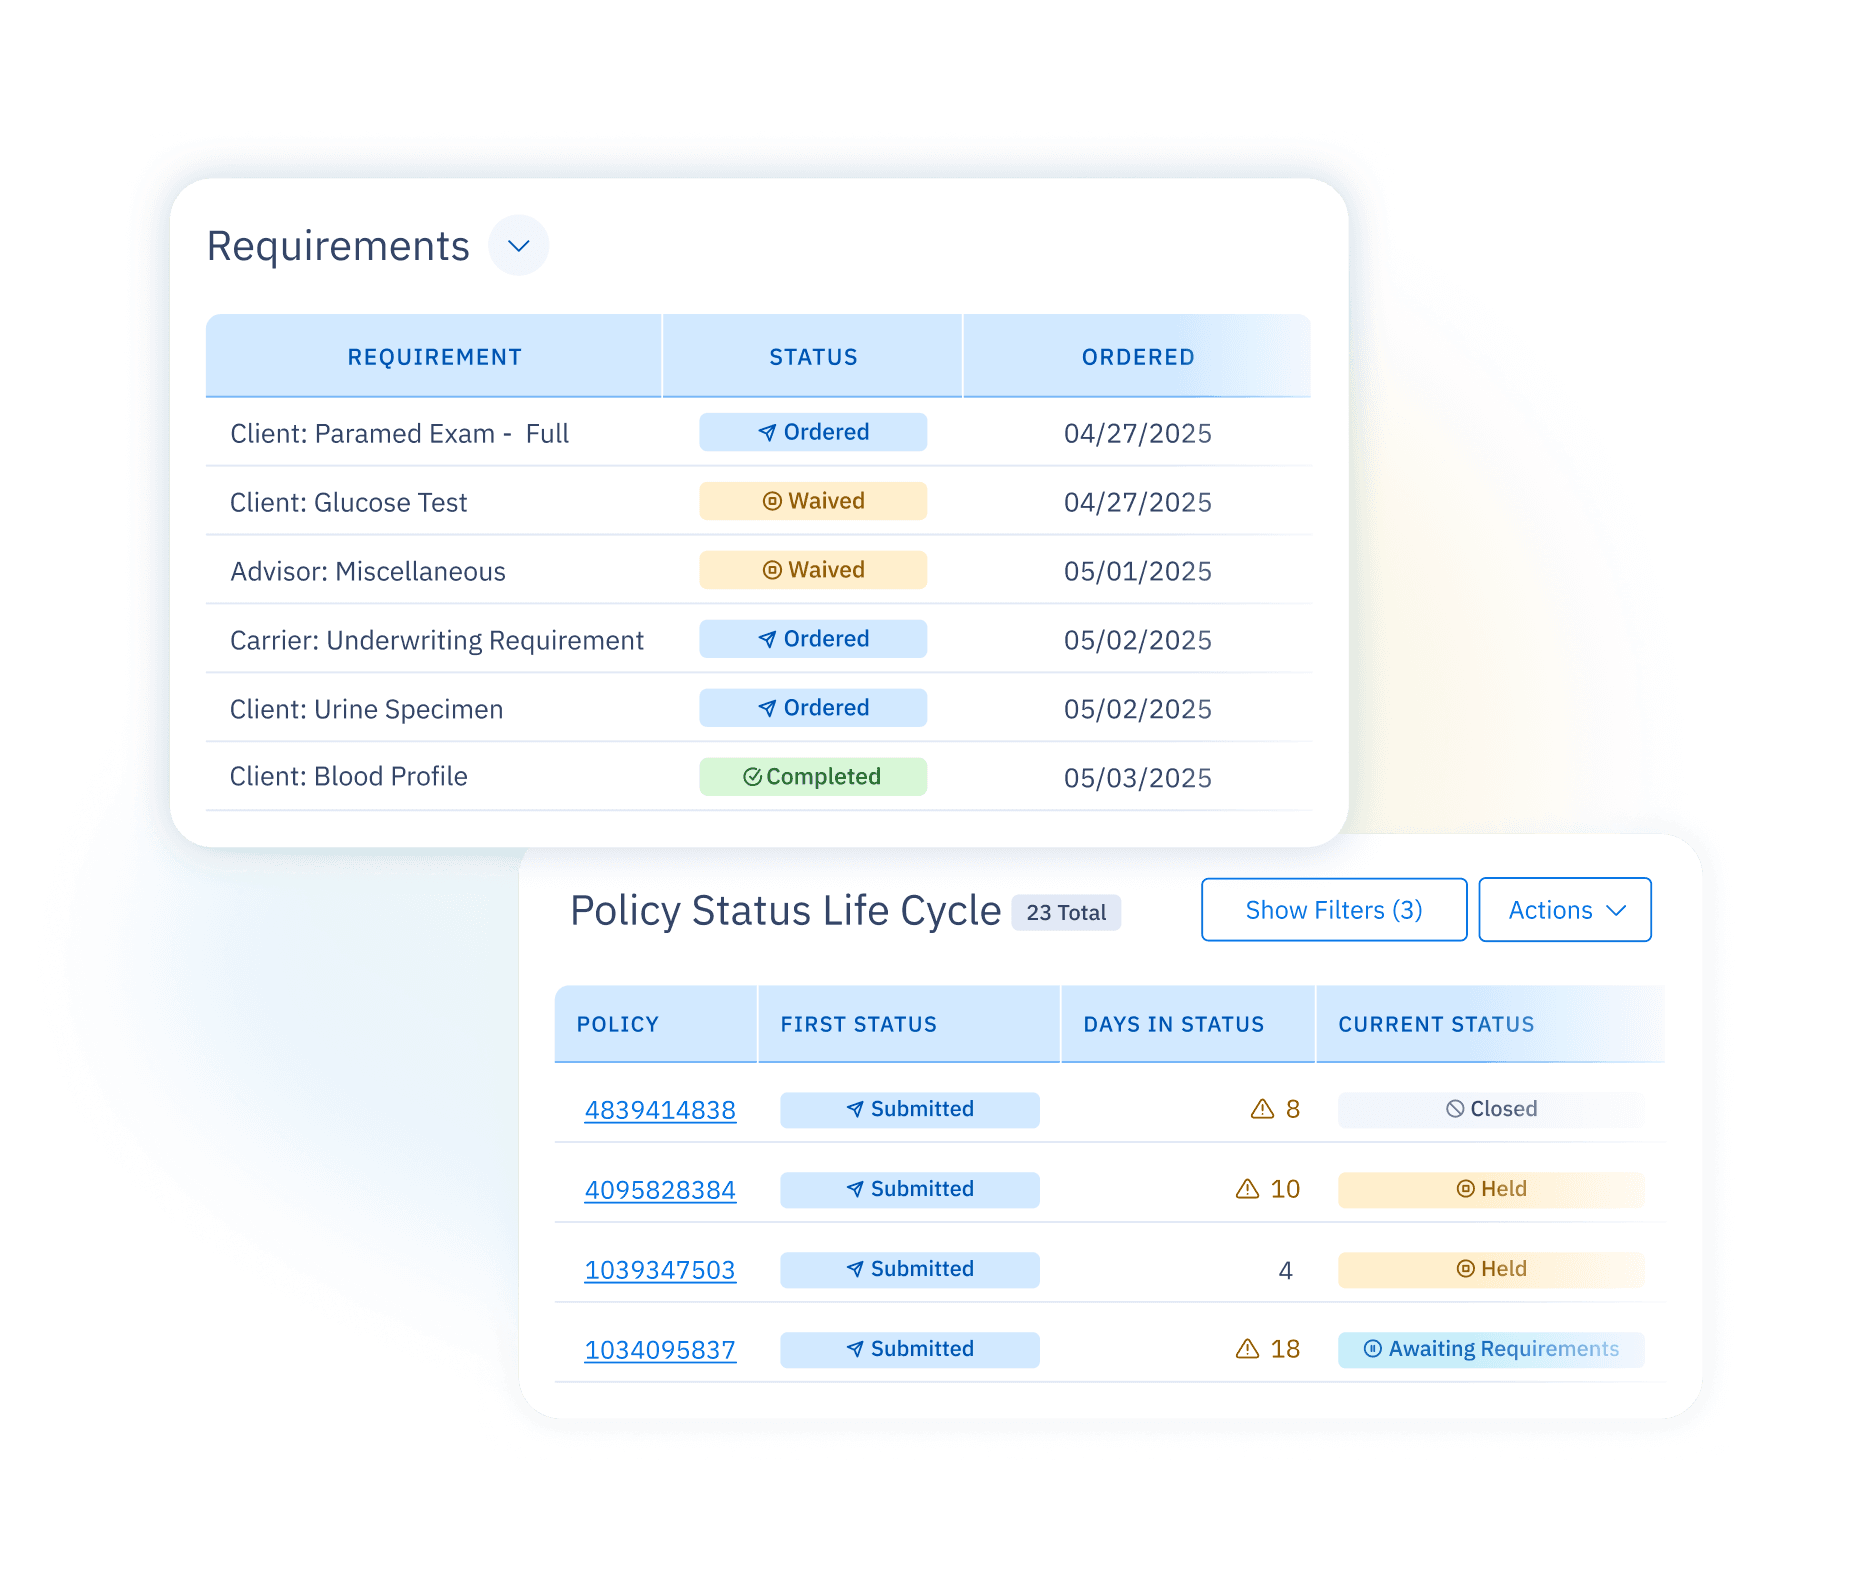
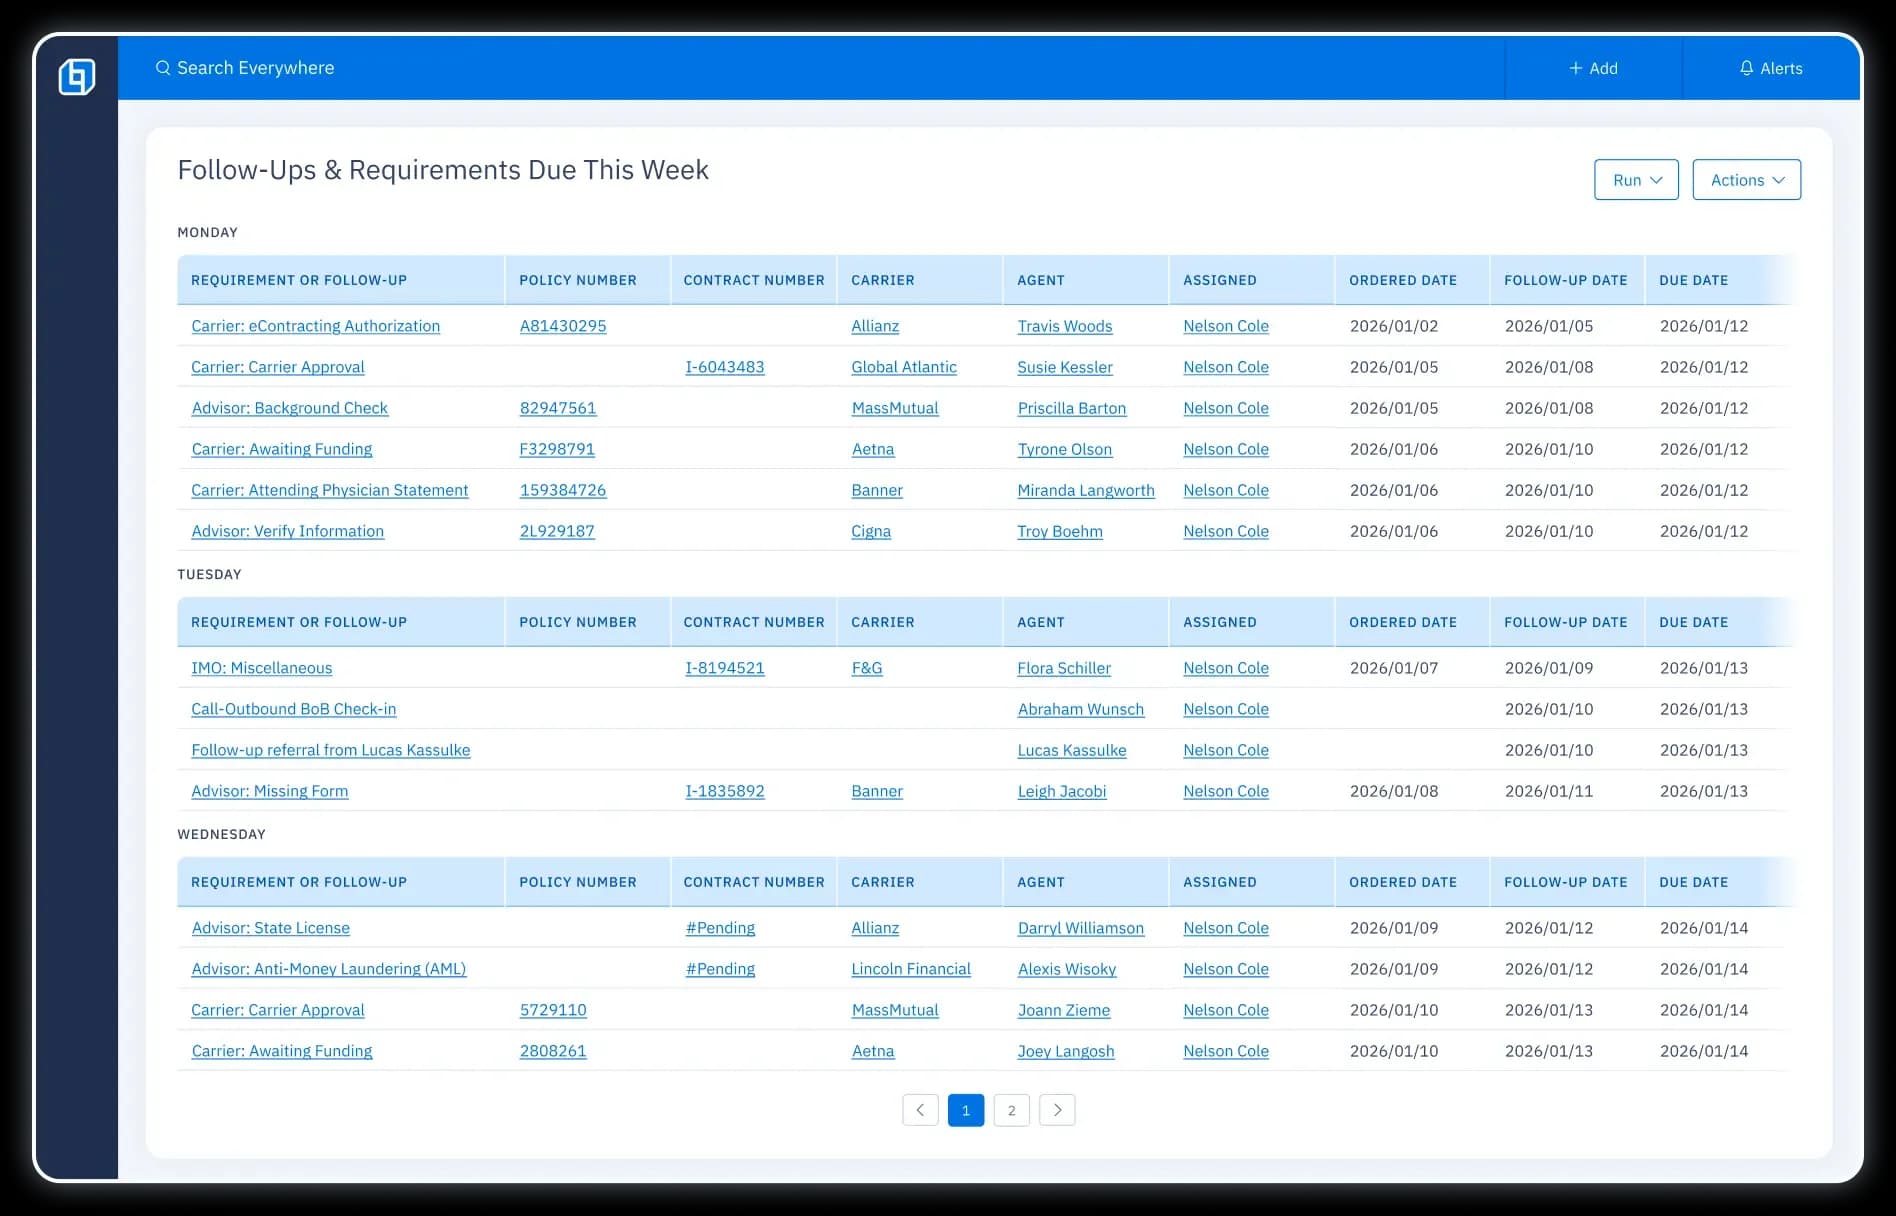
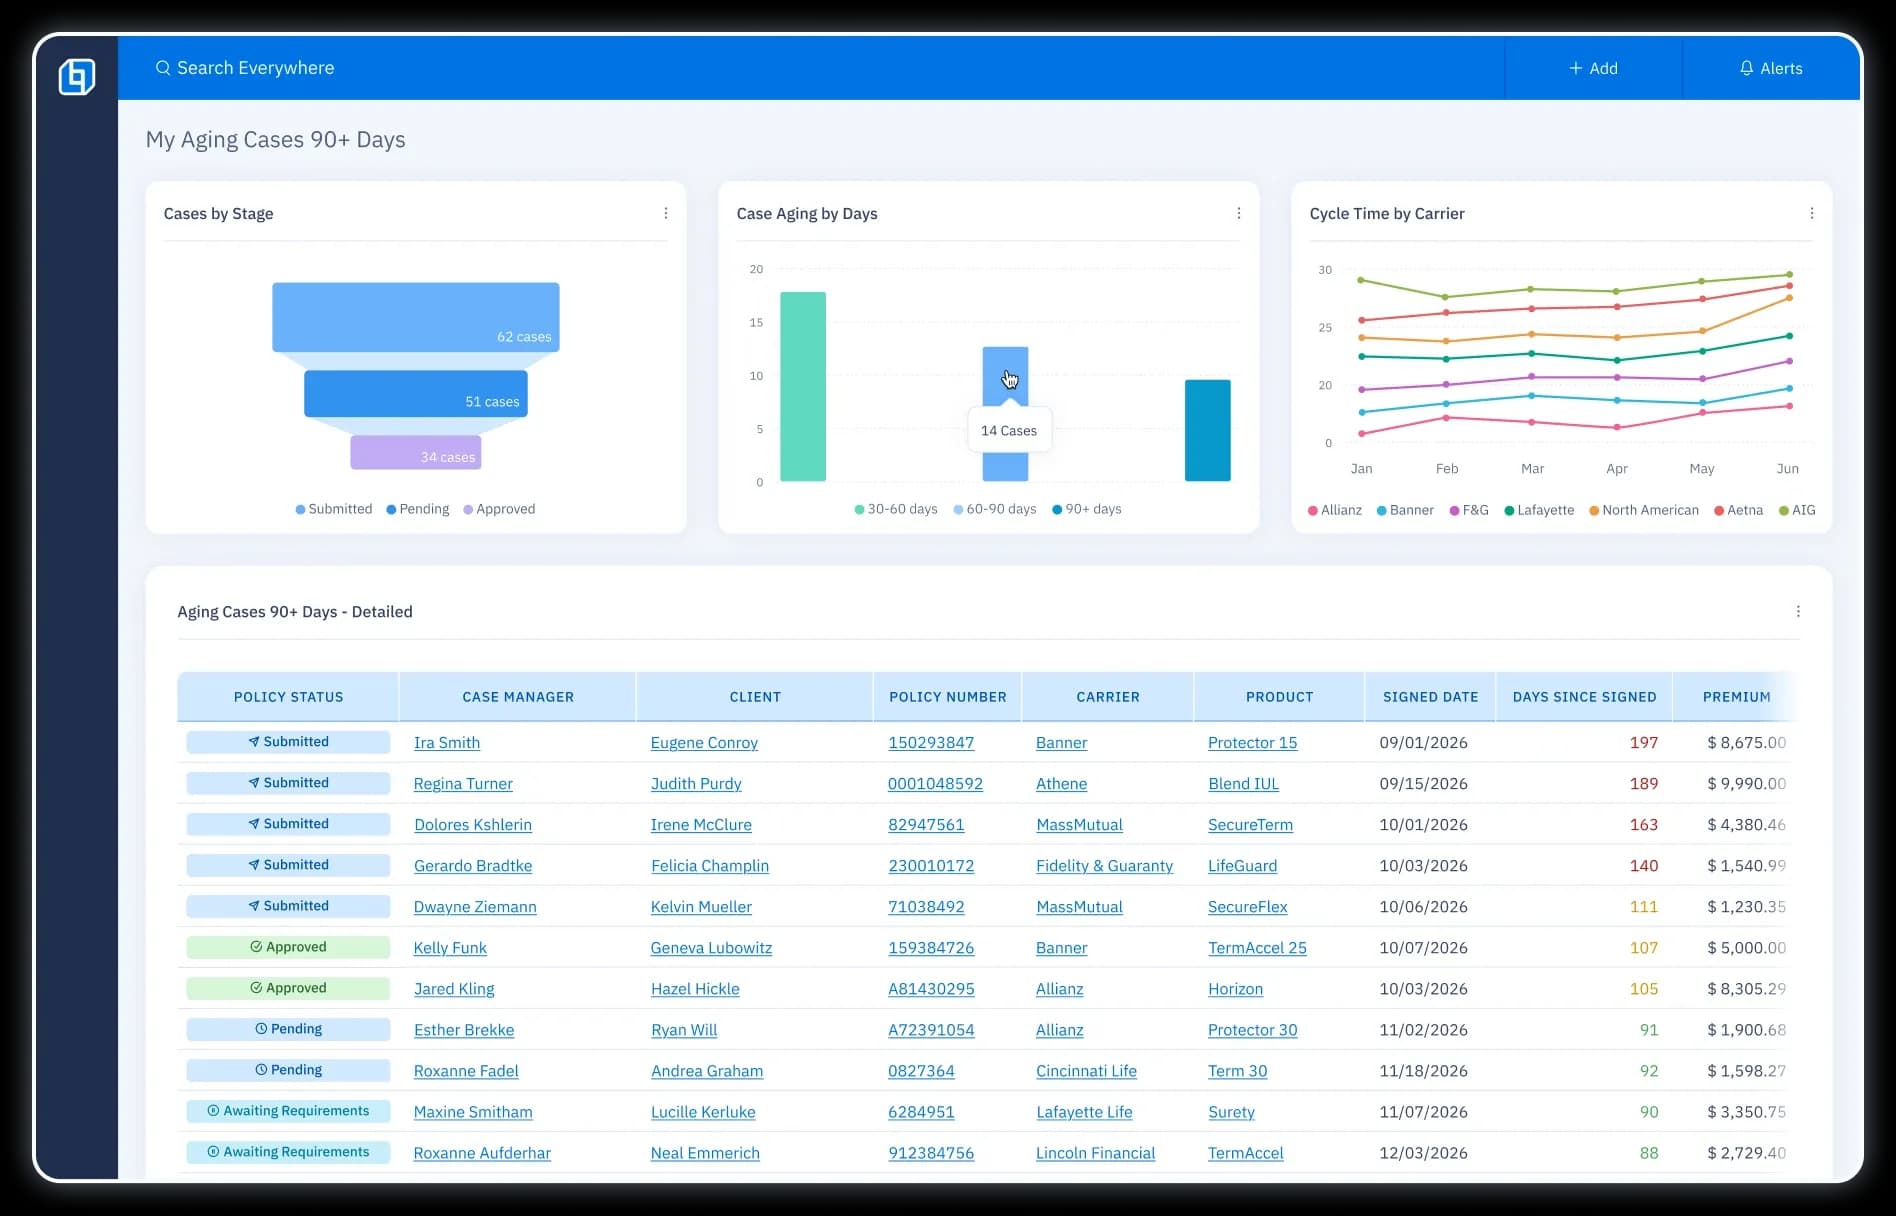
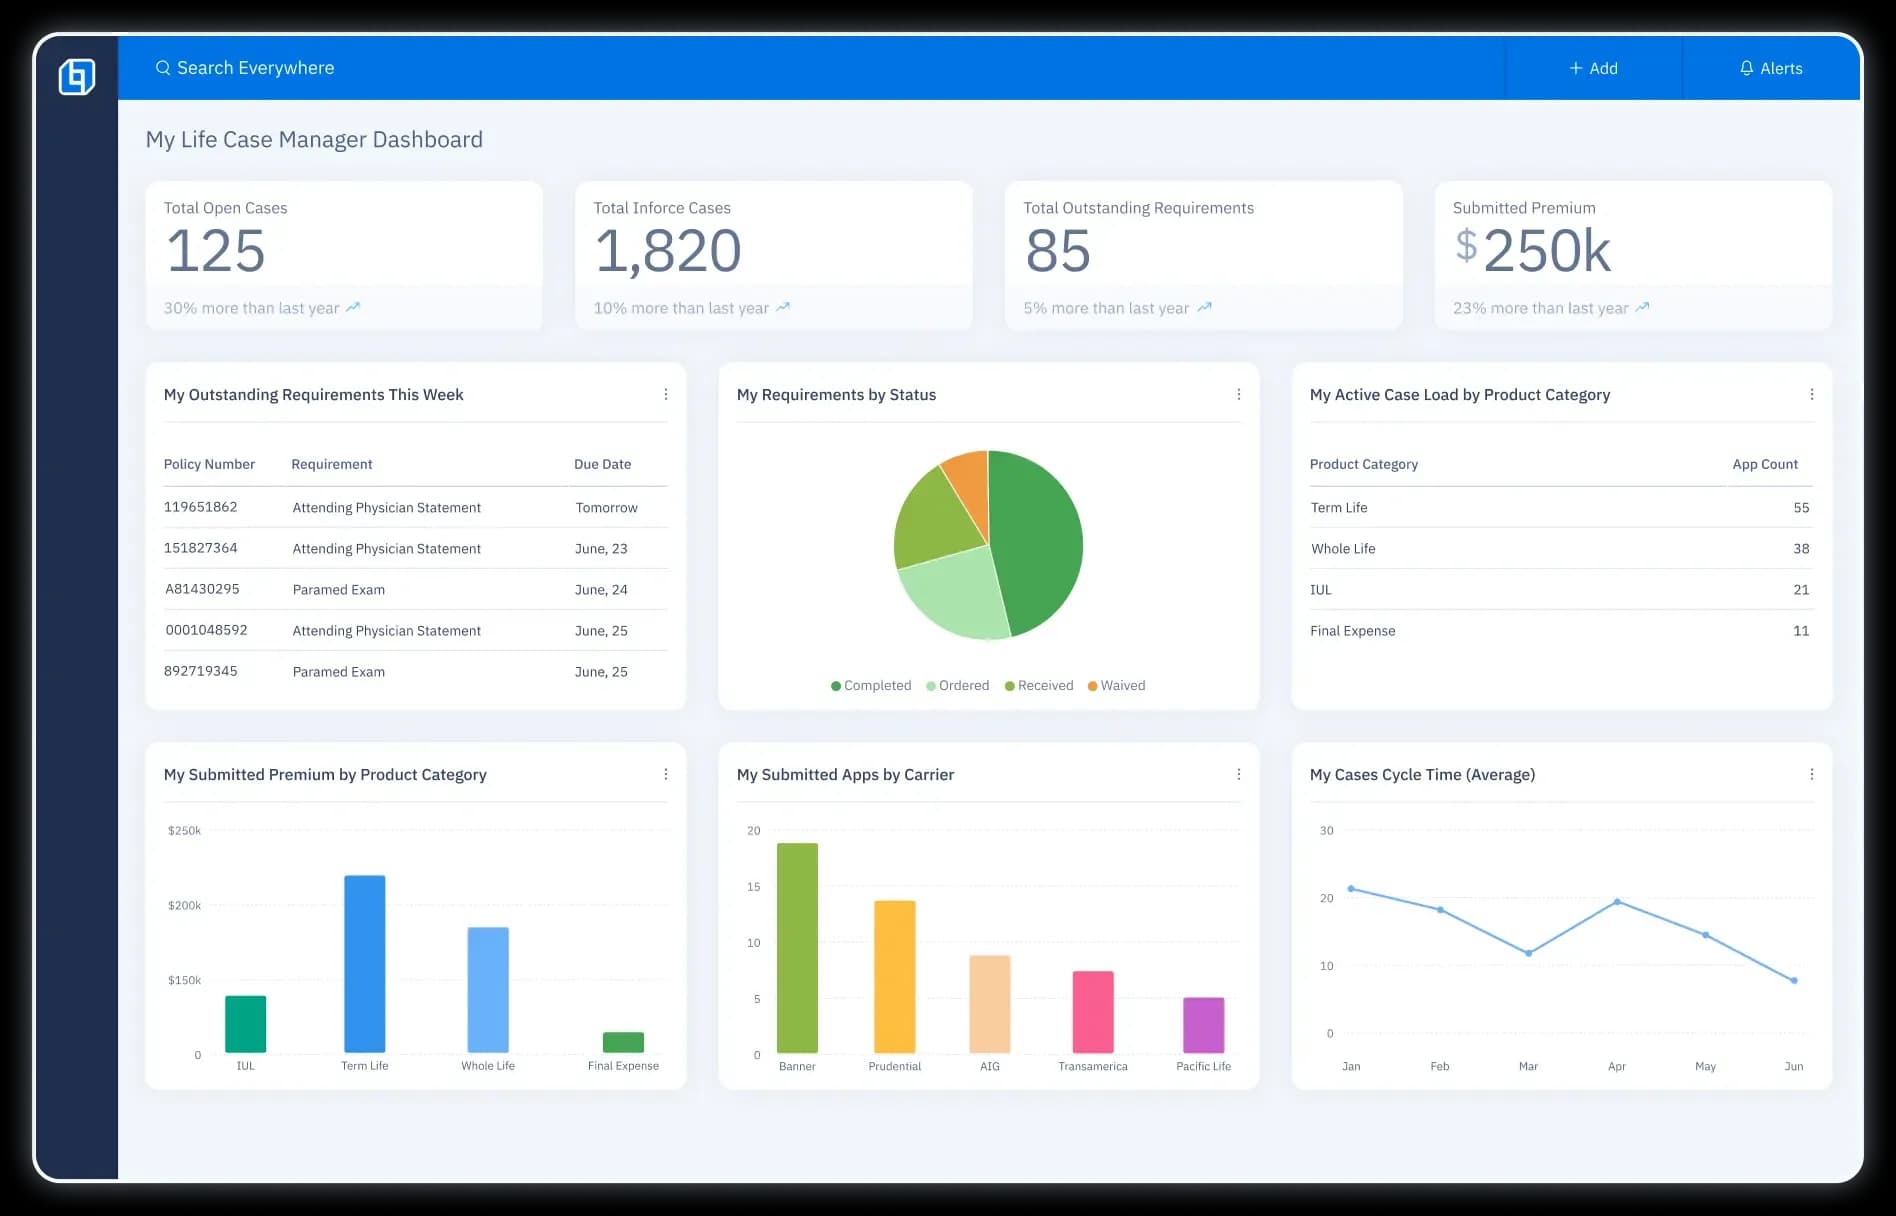
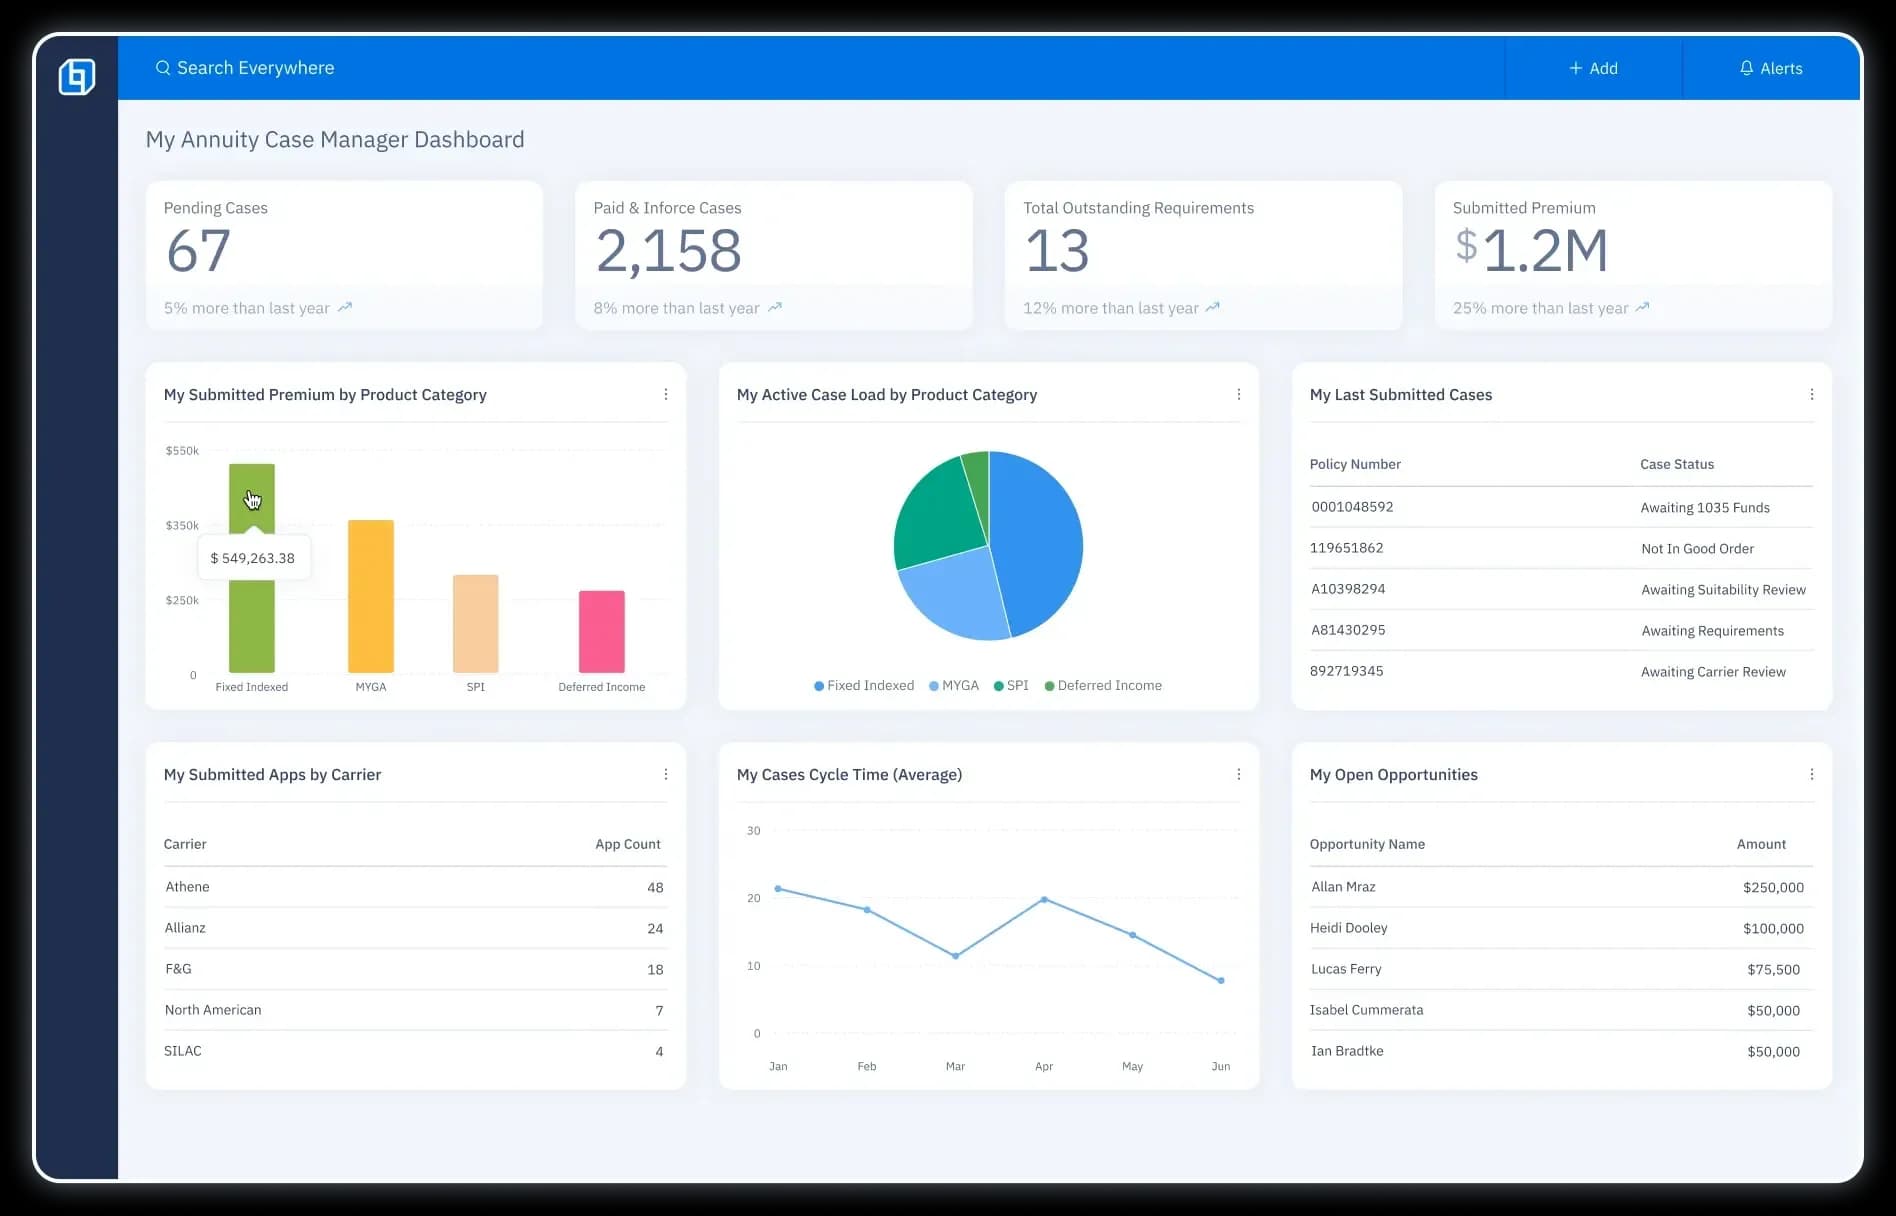
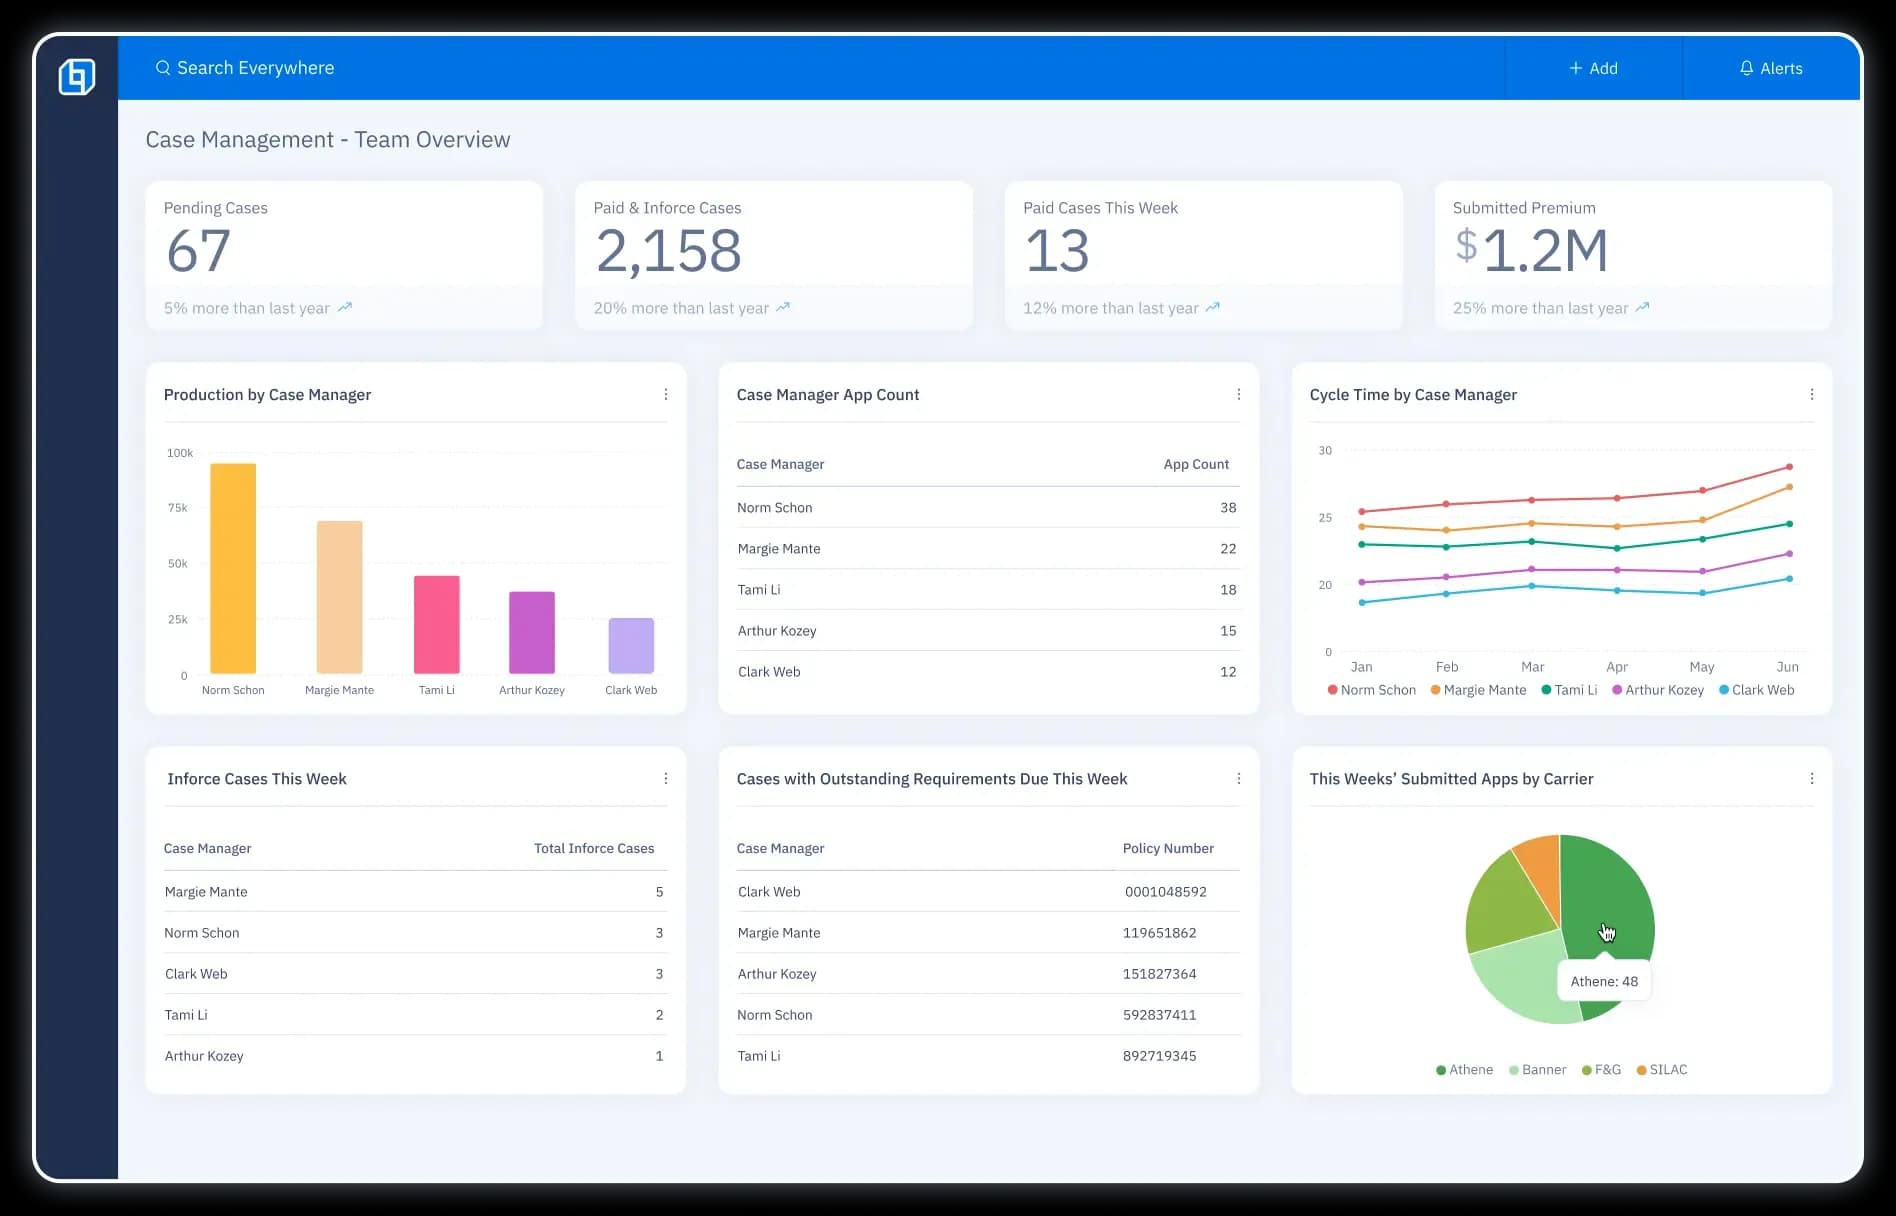
Case Management
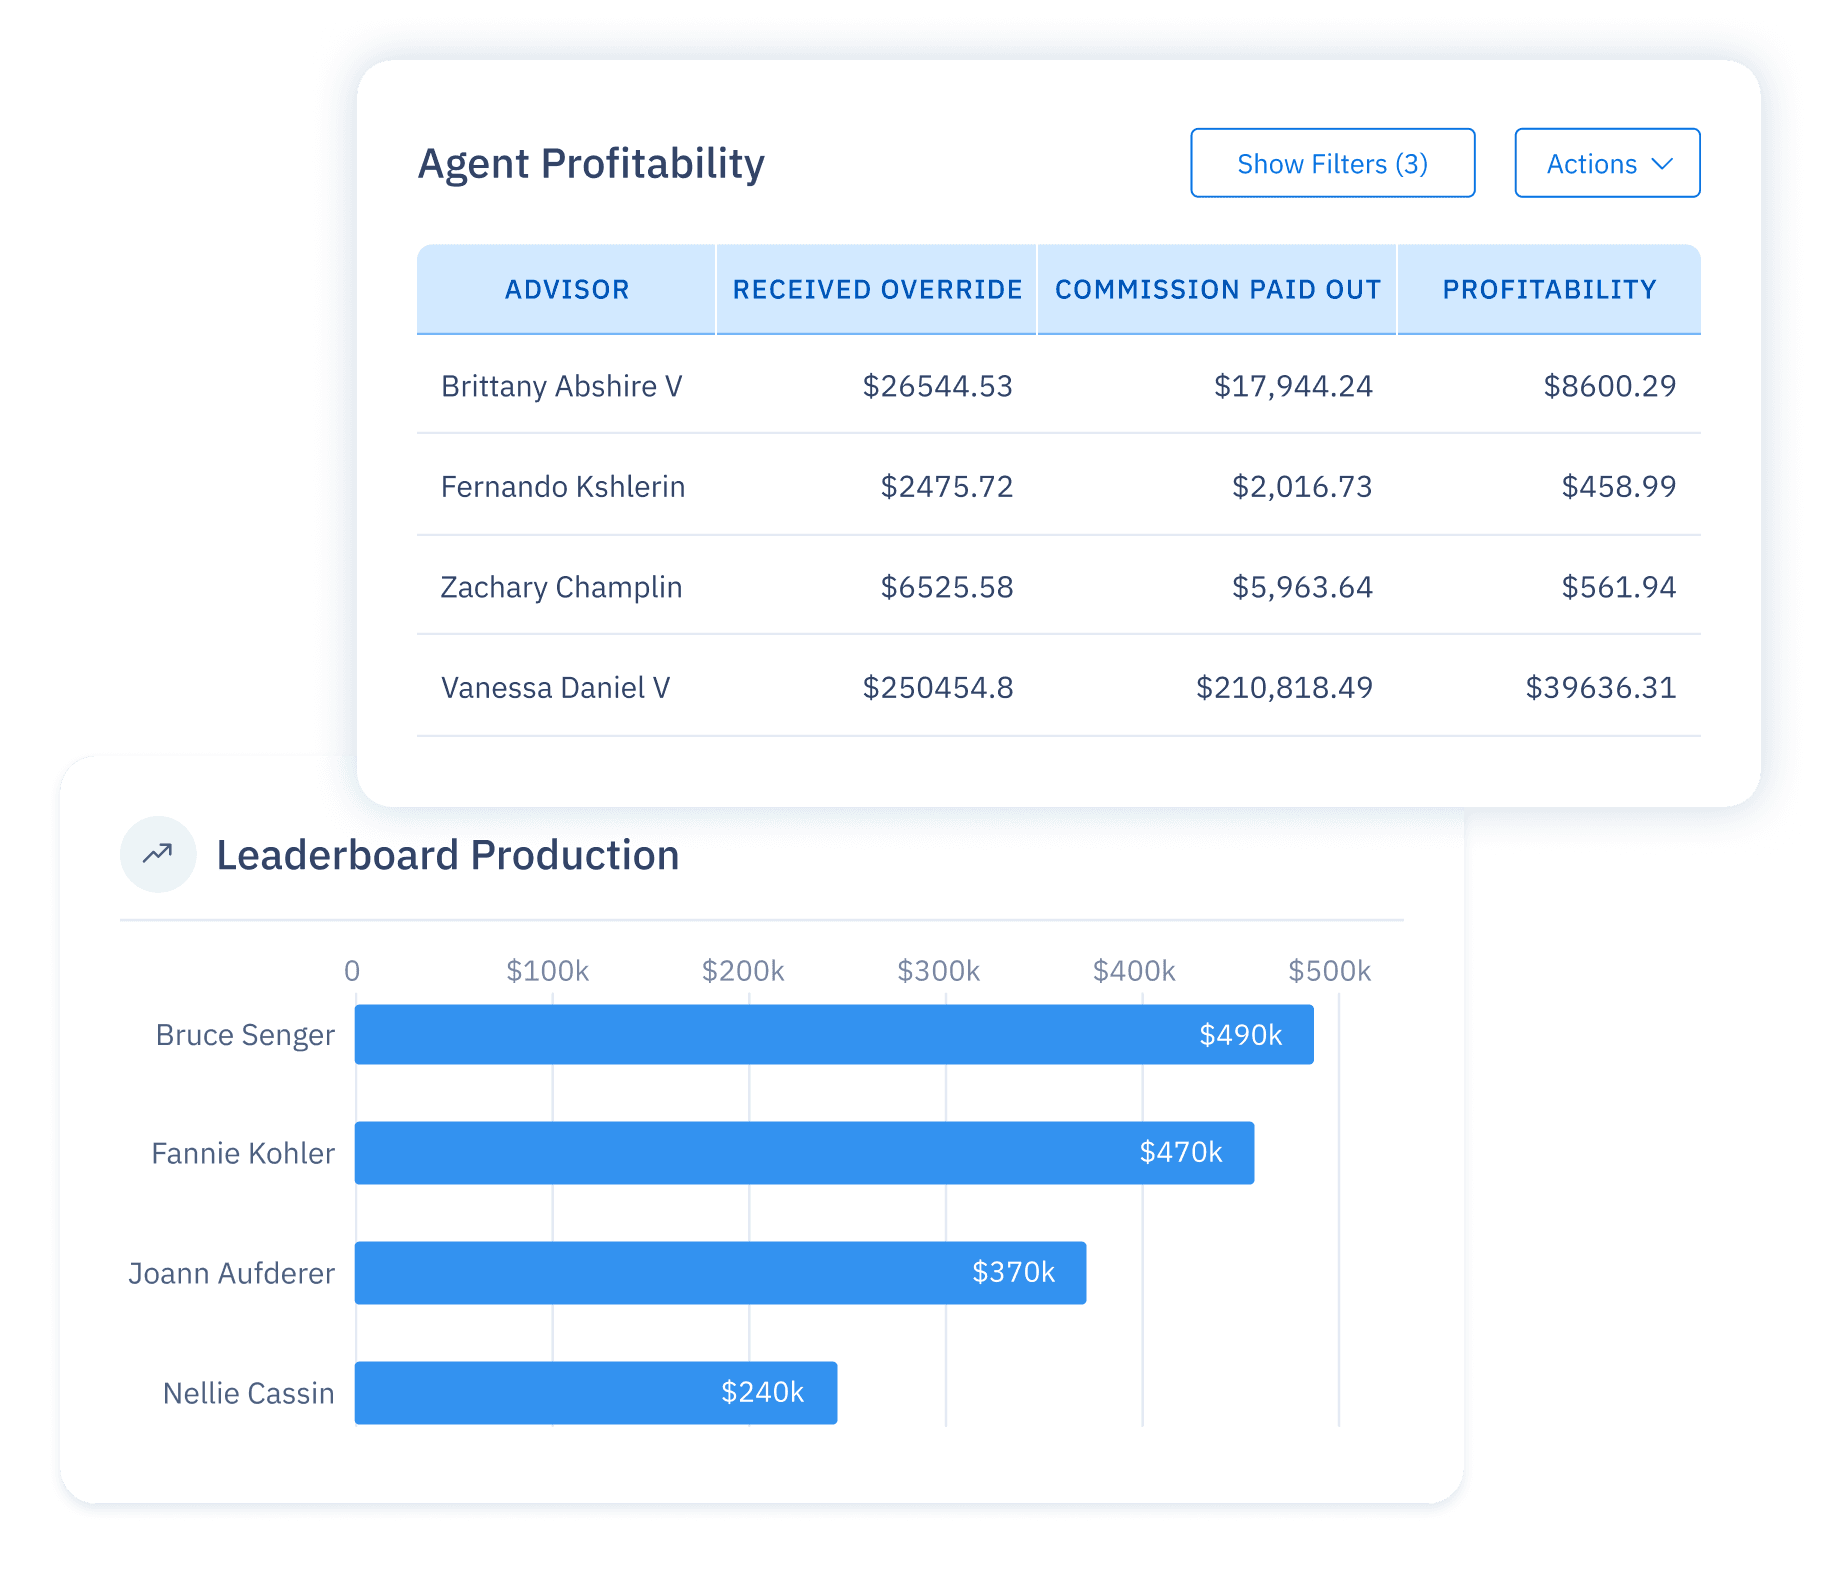
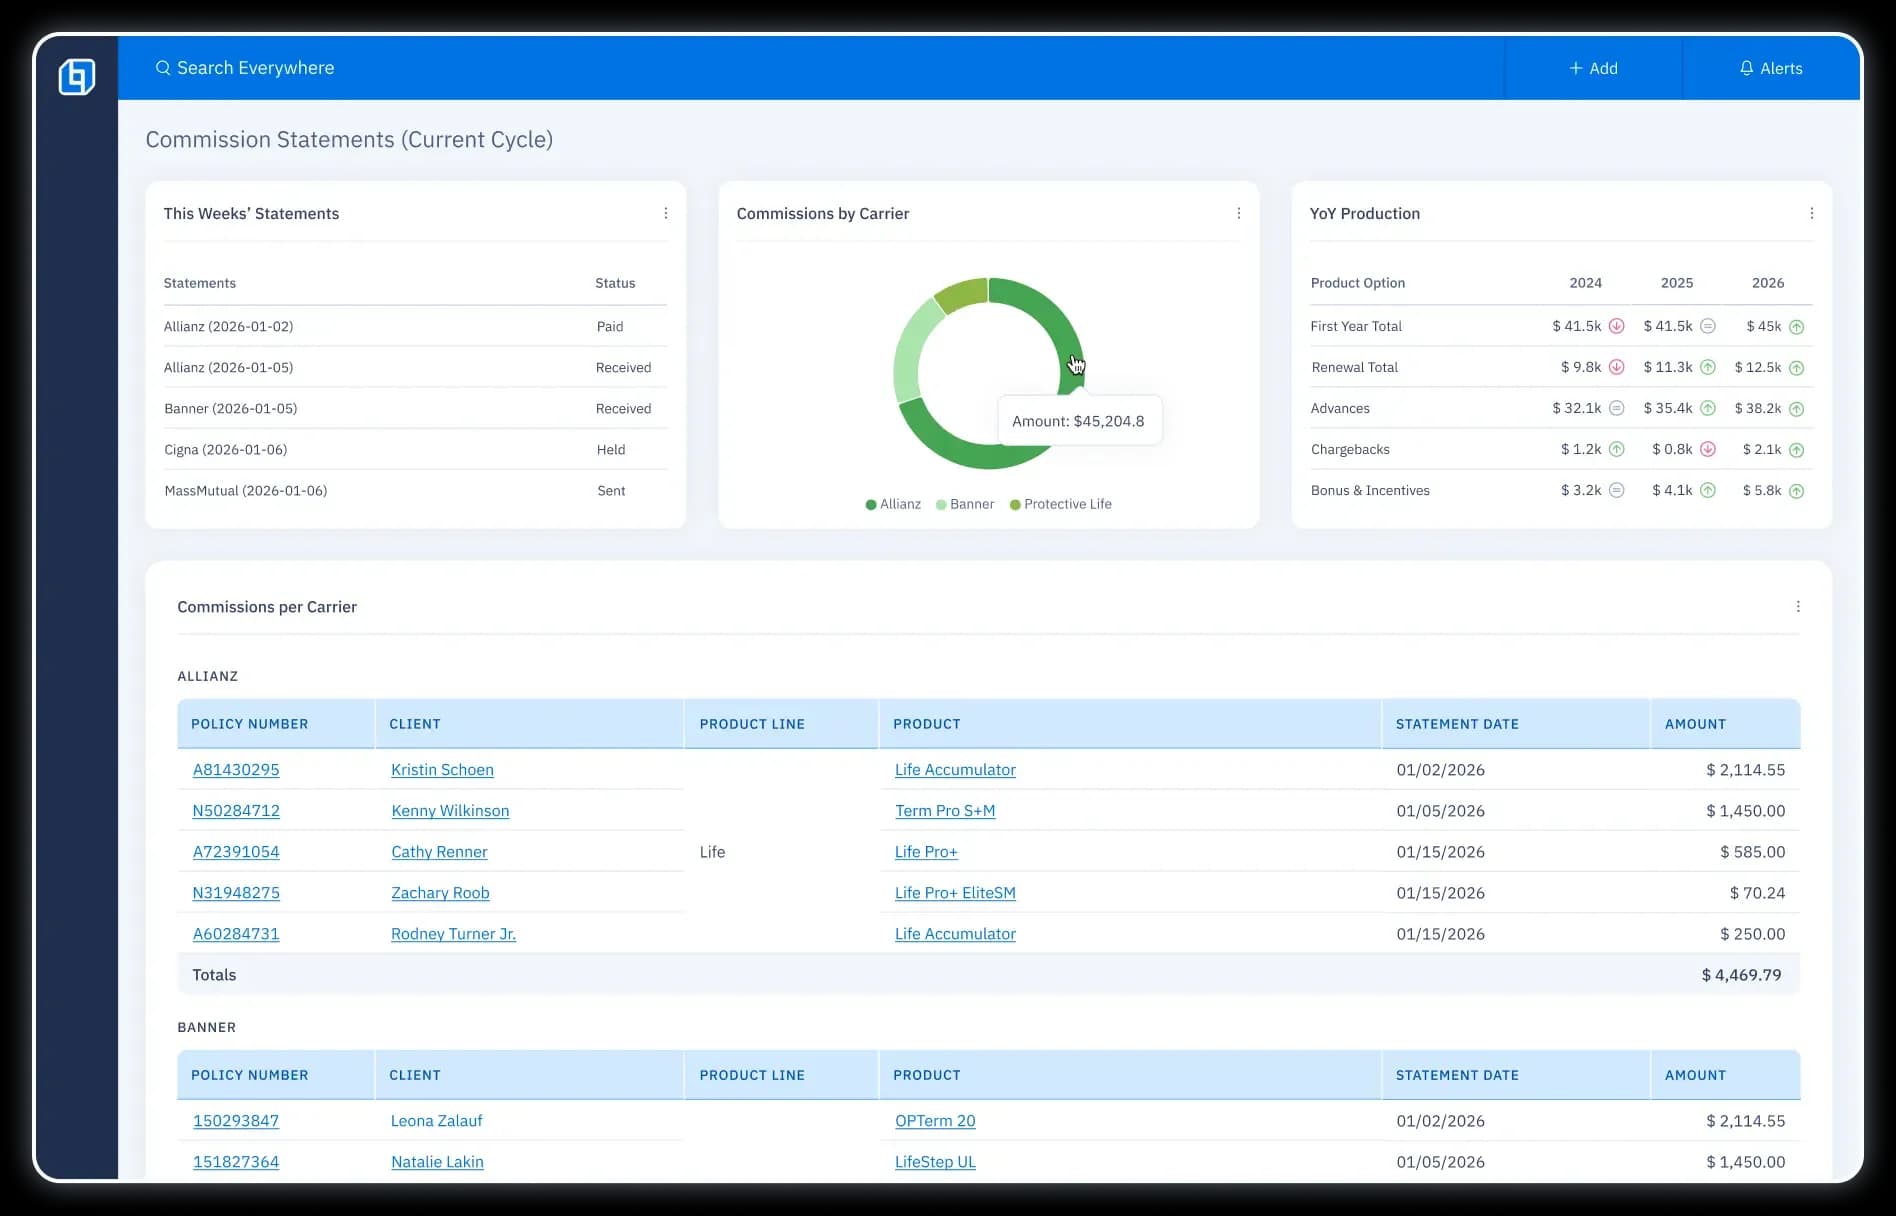
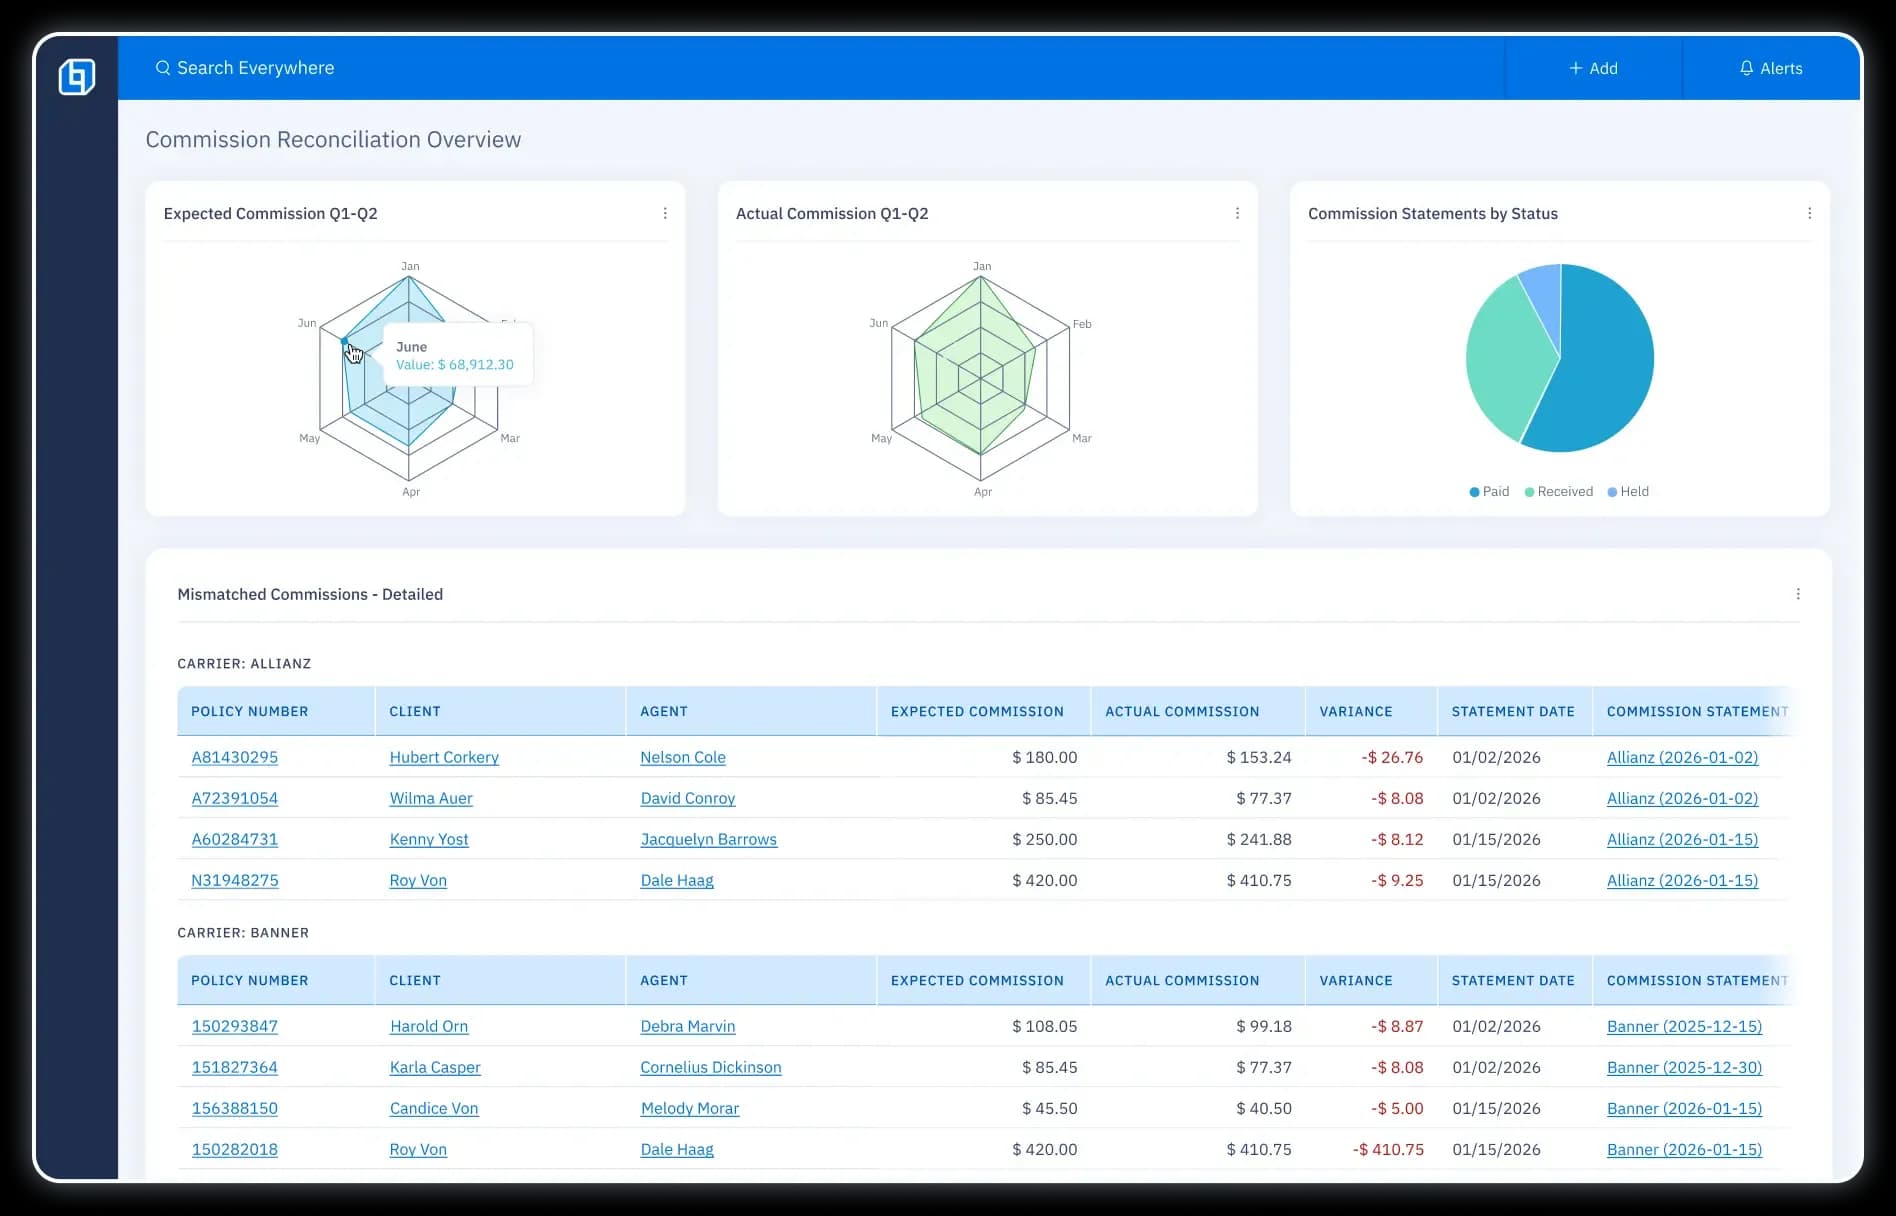
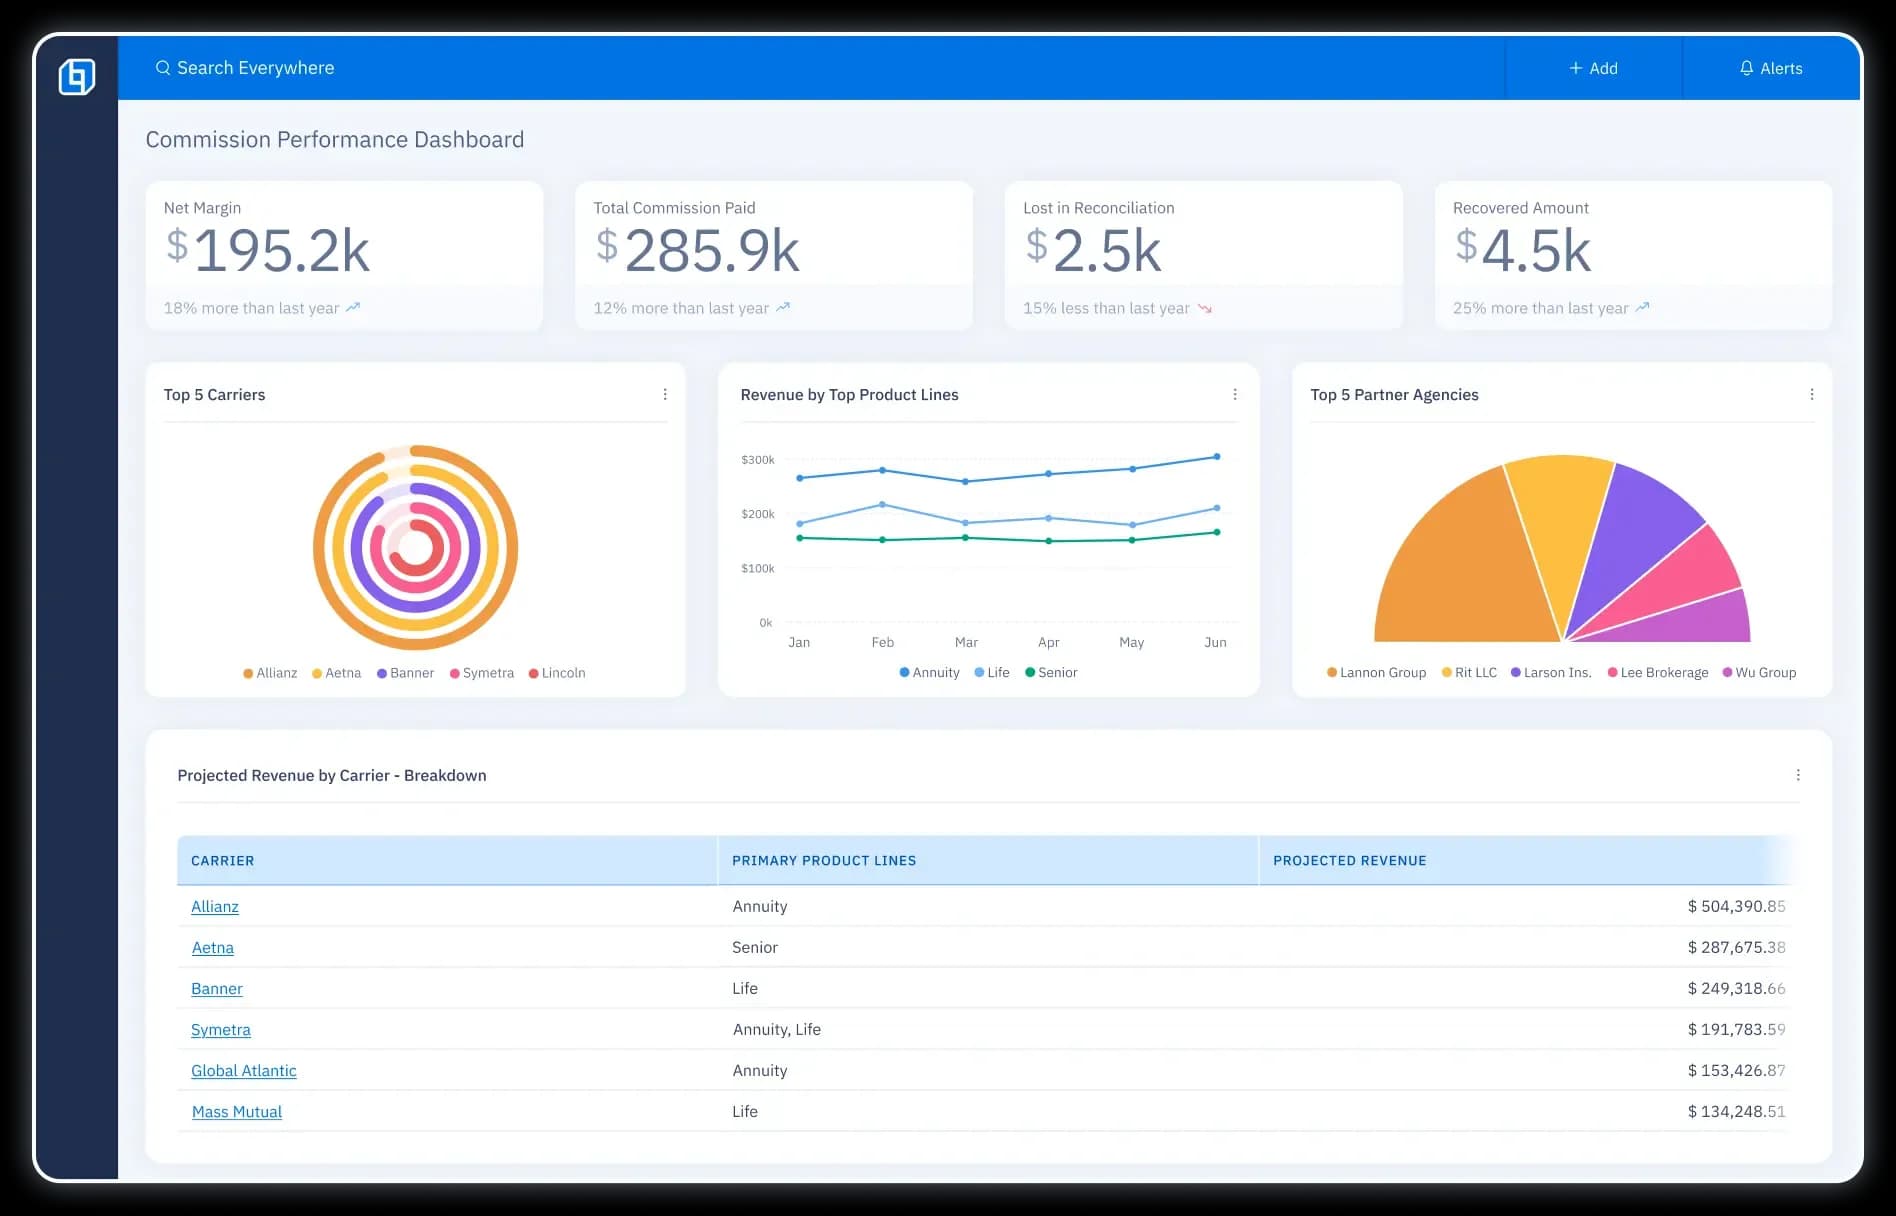
Commissions
Agents


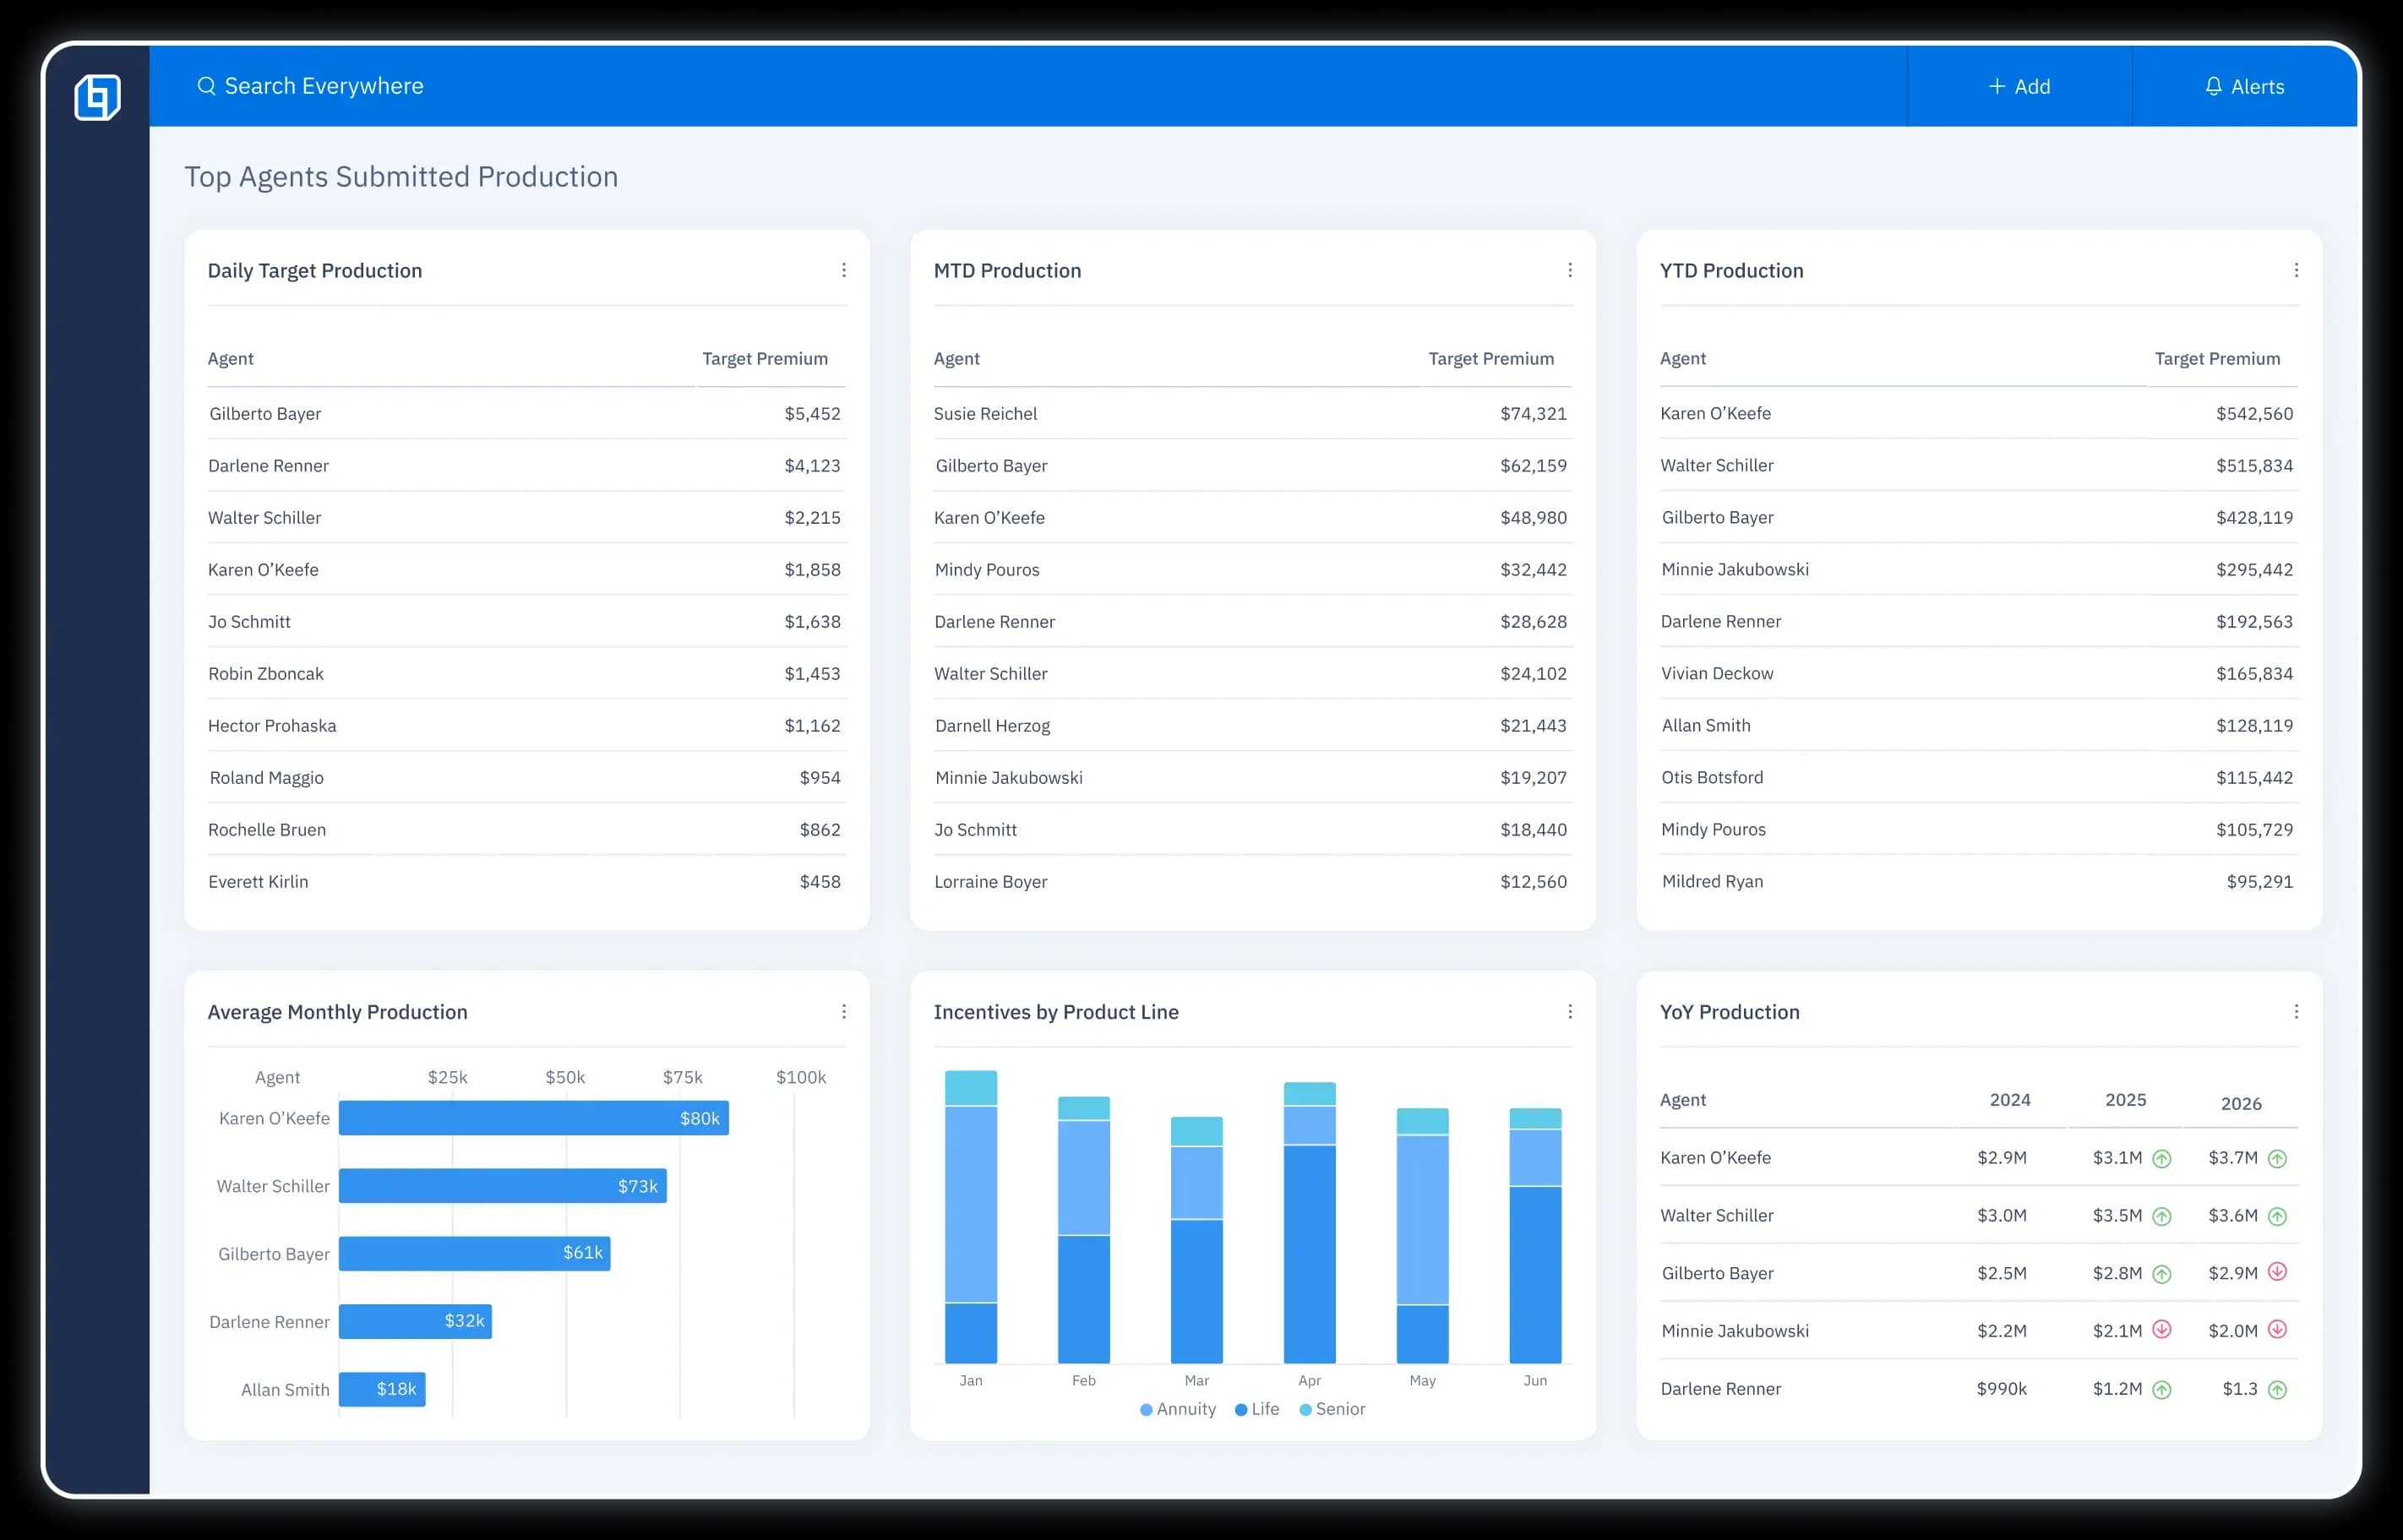
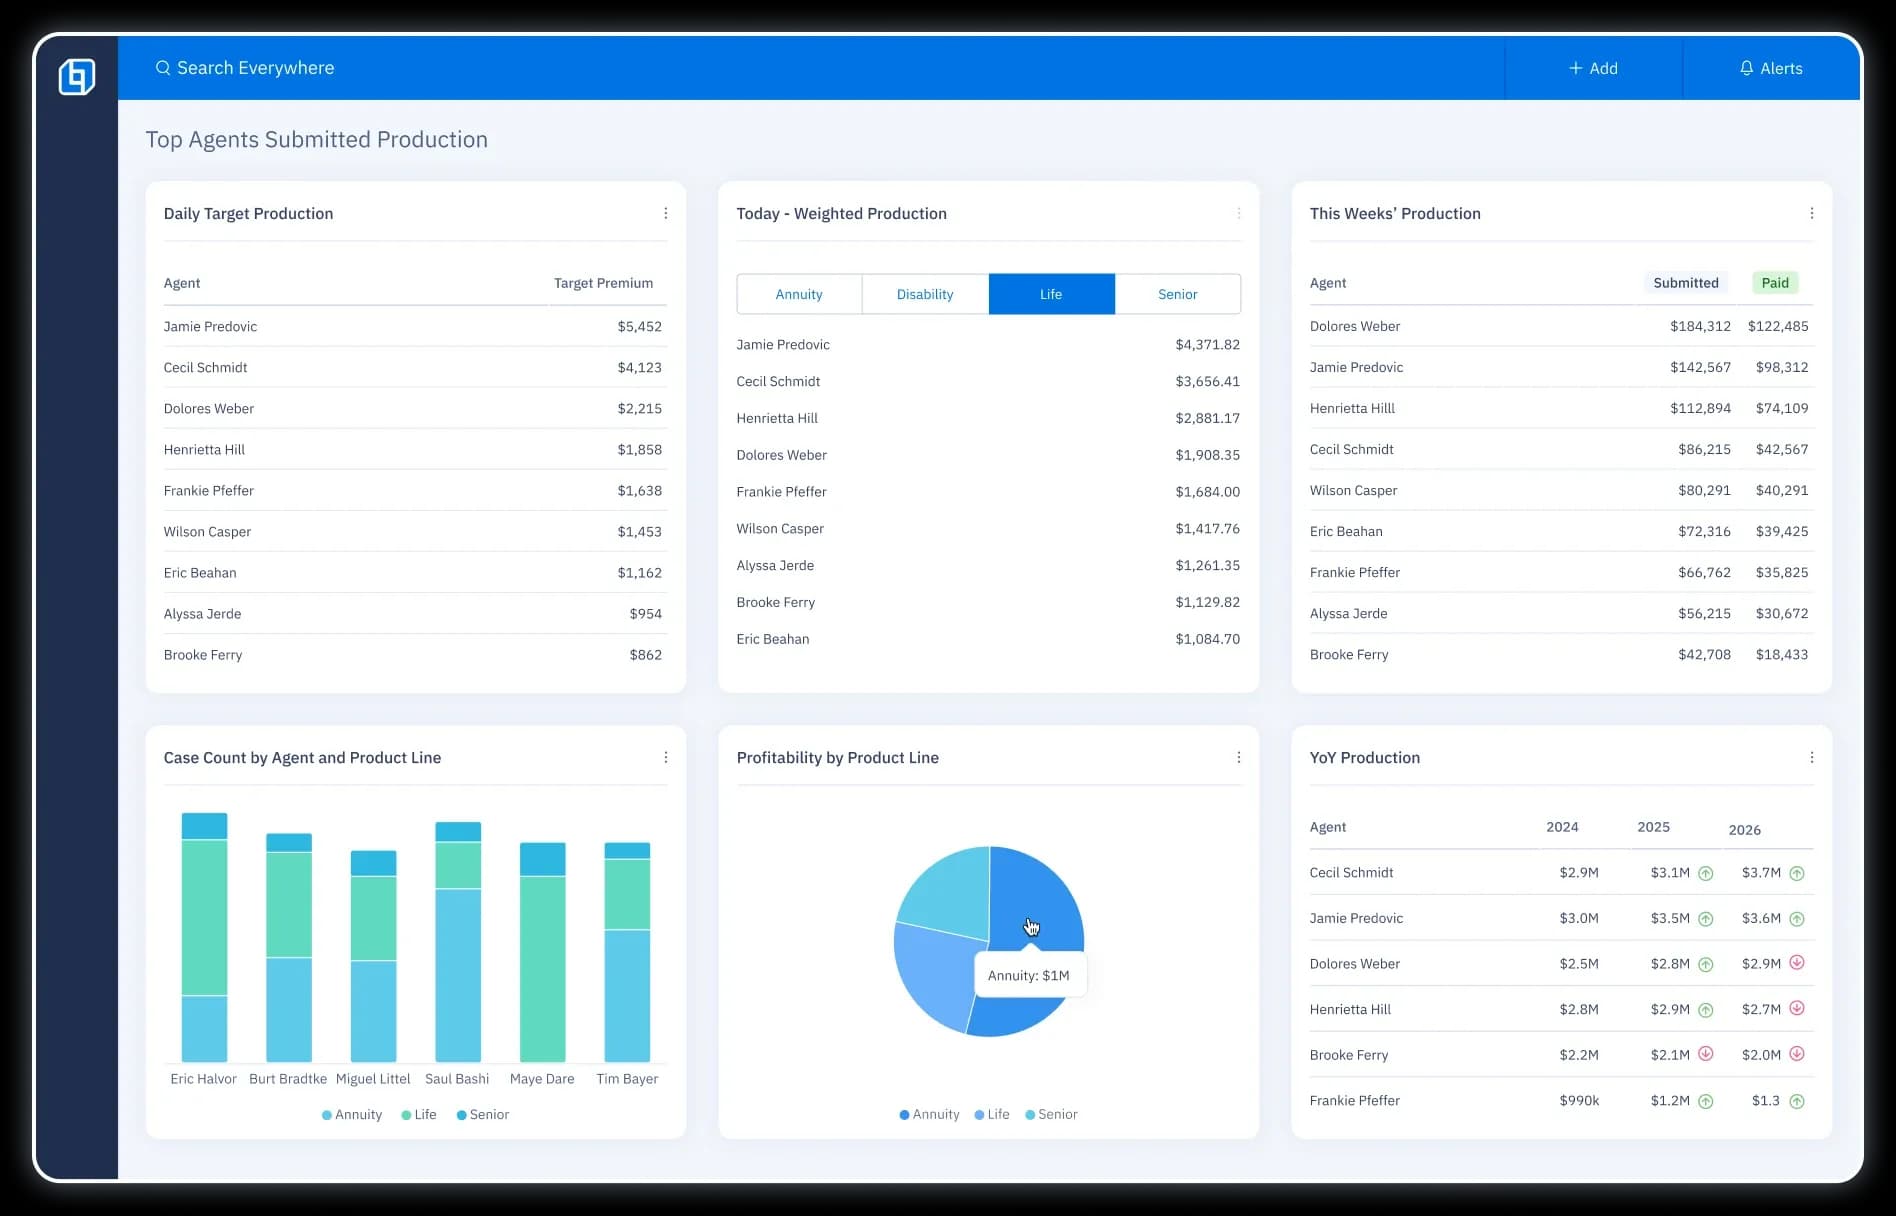
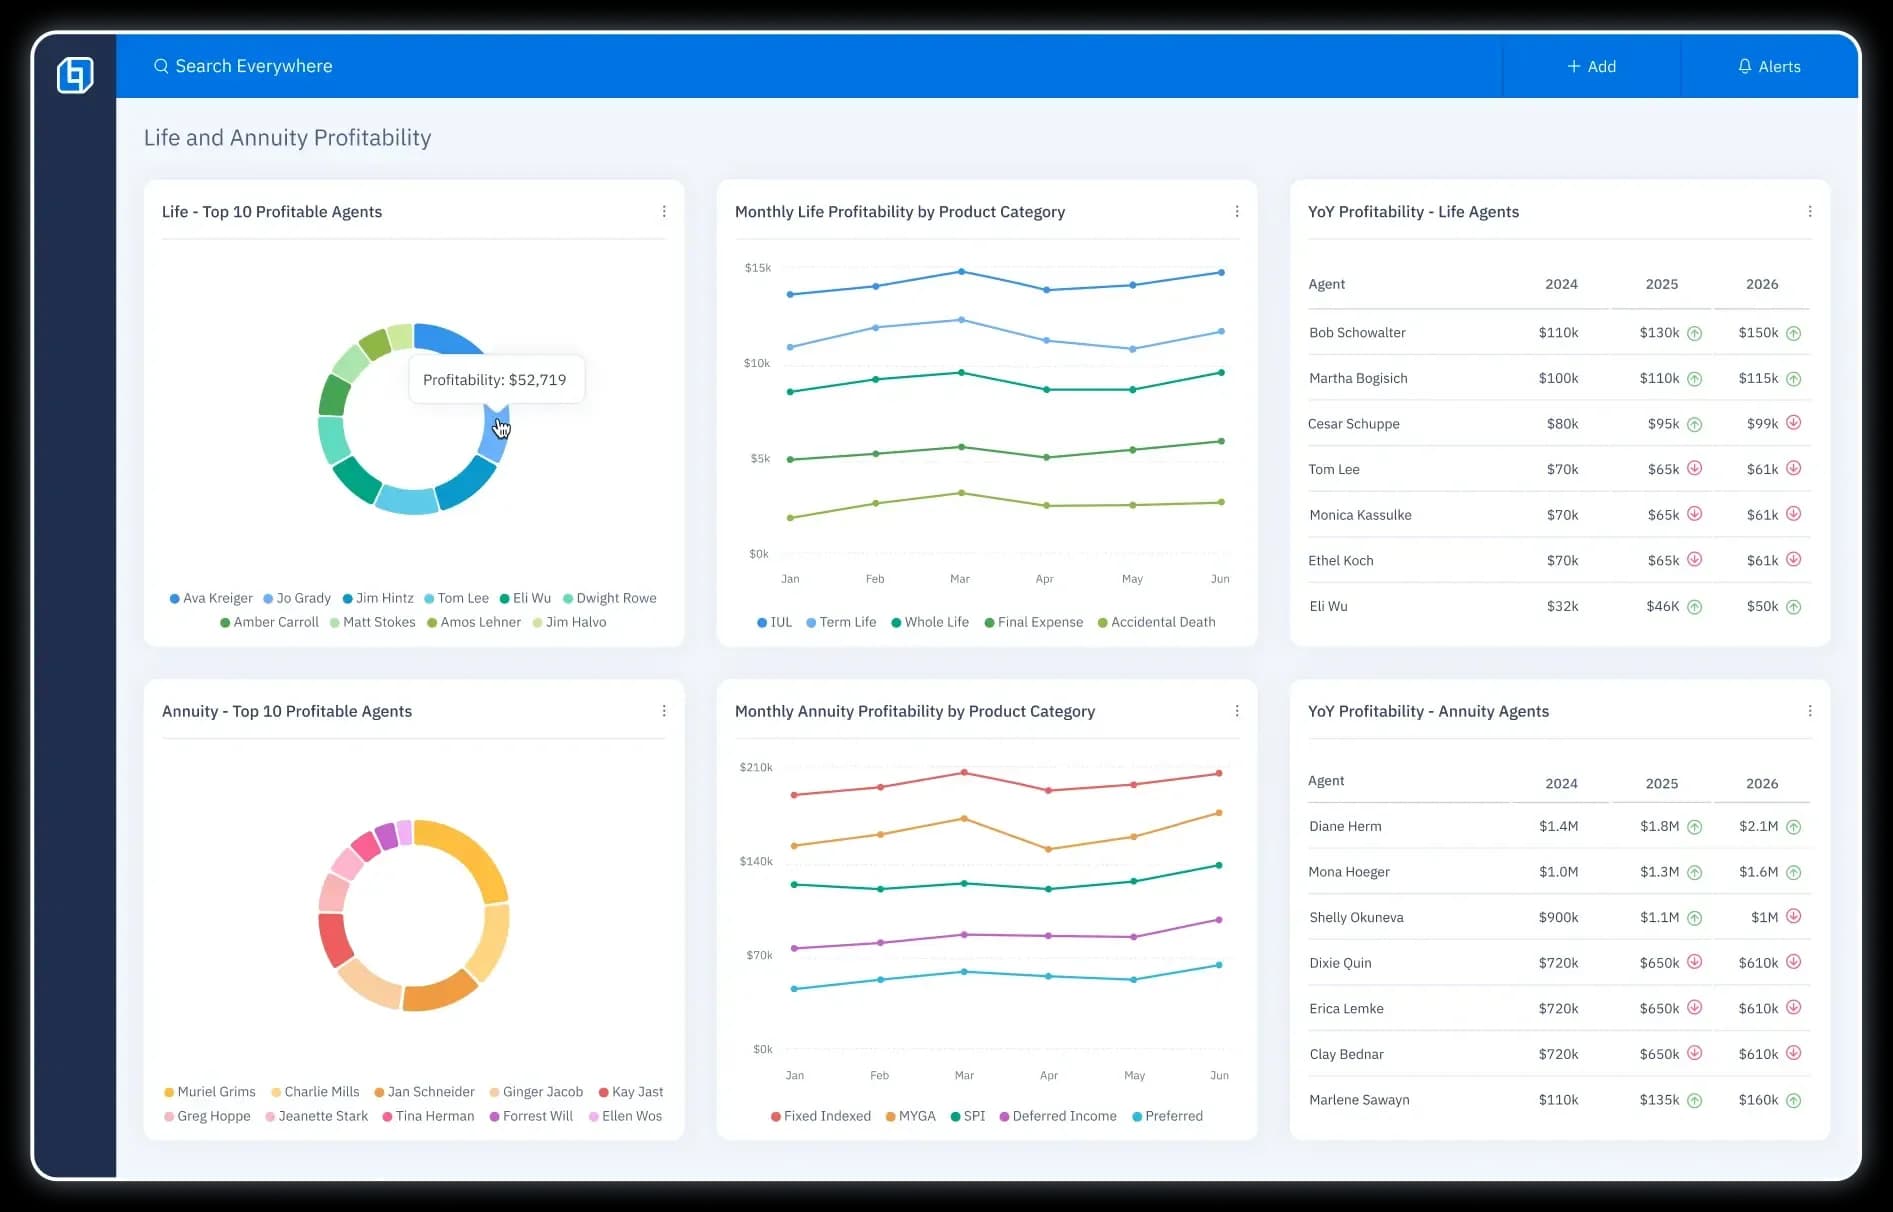
Reports & Dashboards
Data that works for you (for a change).
Launch: Go Live in 3 Steps
Our proven process has had over 100 successful launches, you can trust us to get it right. Regardless of your previous experiences, there is no need to stress—we are your technology partner for life.
1
Discovery
We listen to your problems and we demonstrate the solutions to ensure we're a good fit.
2
Onboarding
We convert 100% of your data, train your team and customize the platform so the transition is not disruptive.
3
Scale
Going Live is just the beginning; our technology and industry experts ensure your business maximizes the use of technology into the future.


Insuritect
“OneHQ really helps my sales team stay on task and get the follow ups that they need to get a prospect to cross the finish line.”
Justin Snapp | CEO
Help is here. Whenever and however you need it.
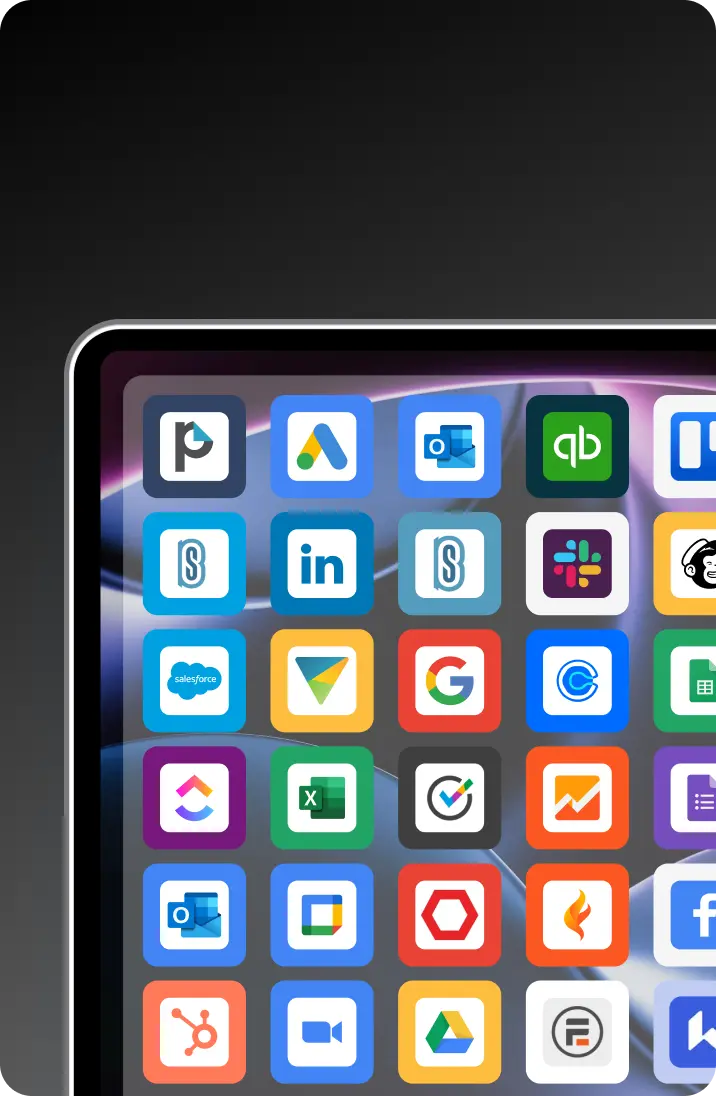
Integrations
500+ integrations to automate the busy work.
Developer's Guide
Resources to unlock the full potential of our platform.

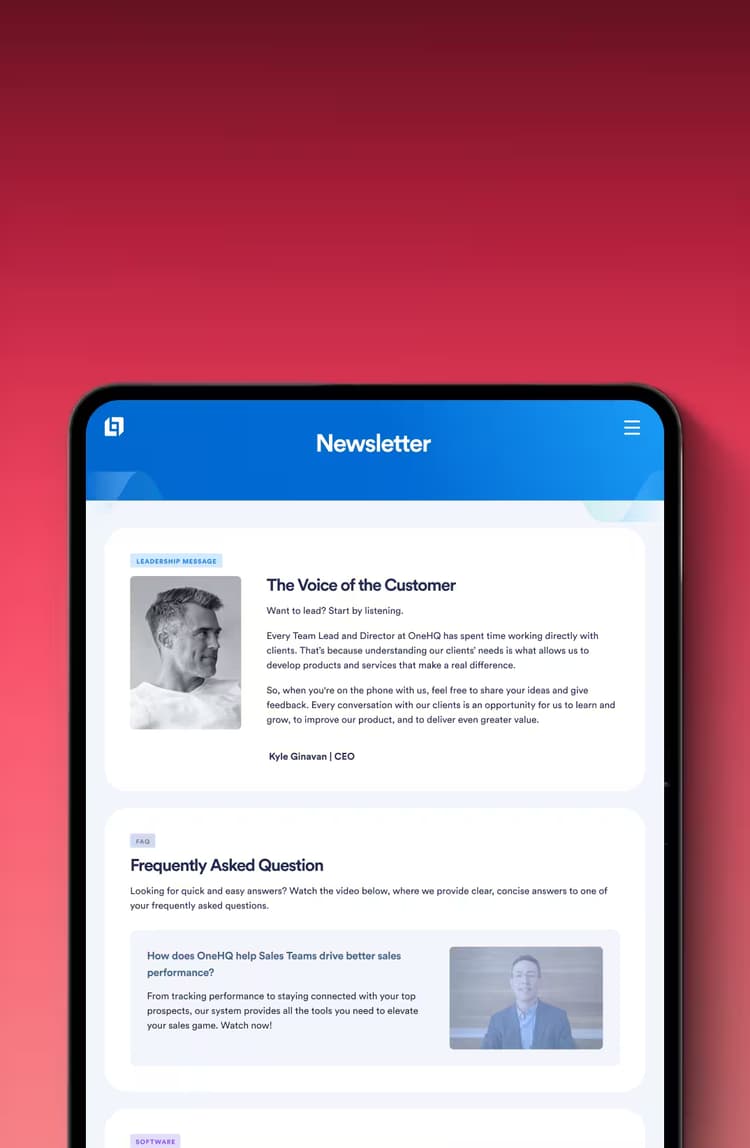
Newsletter
Receive the latest updates and product news.
Case Studies
Explore real success stories.

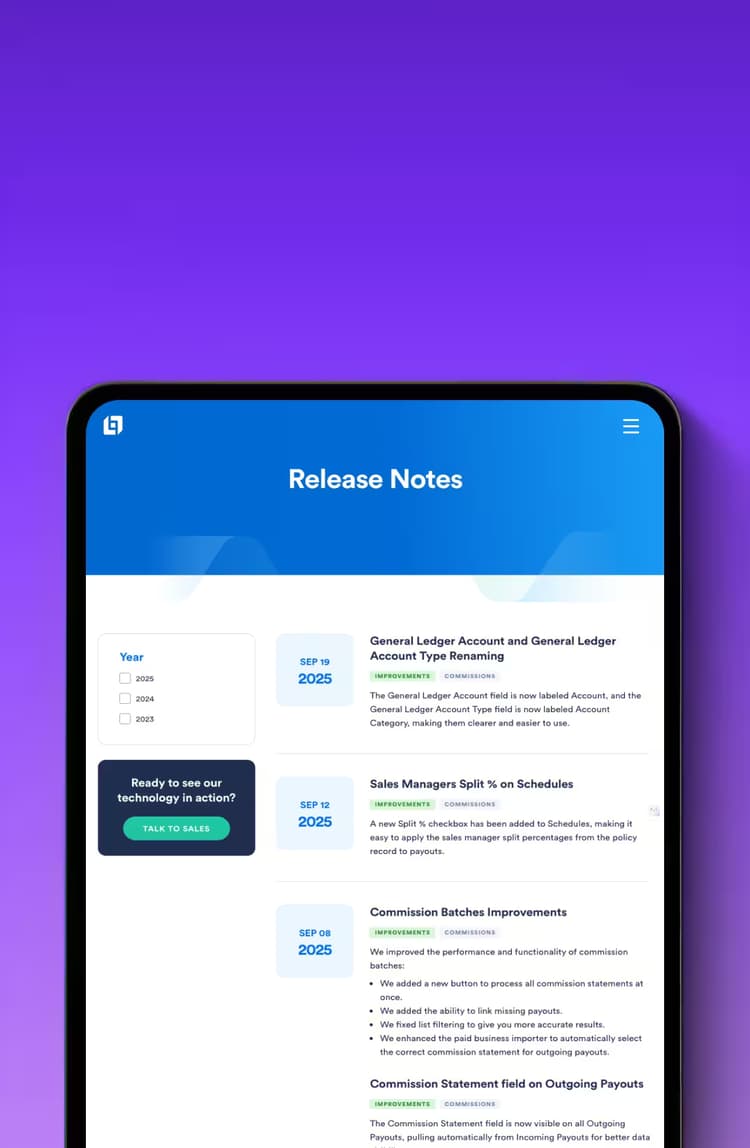
Release Notes
Stay up to date with our latest improvements.
FAQs
Get answers to your most pressing questions.

Integrations
500+ integrations to automate the busy work.
Developer's Guide
Resources to unlock the full potential of our platform.
Newsletter
Receive the latest updates and product news.
Case Studies
Explore real success stories.
Release Notes
Stay up to date with our latest improvements.
FAQs
Get answers to your most pressing questions.